COD-AB: a common map for humanitarian response
Administrative boundaries, the shared standard, and the tools that build them
Every humanitarian response depends on partners agreeing where places are and what they’re called. This talk covers four things: what COD-ABs are and why they matter, the problems with how boundary data is produced today, how UN agencies are growing COD-AB into one shared standard, and the tools OCHA built to clean and package boundaries to that standard. The tools run in the browser with nothing to install, so the demos are live.
The notes are written to be read as is, so anyone can present this deck. Press P for presentation mode and use the arrow keys to move between slides.
COD-ABs: the common map of a humanitarian response
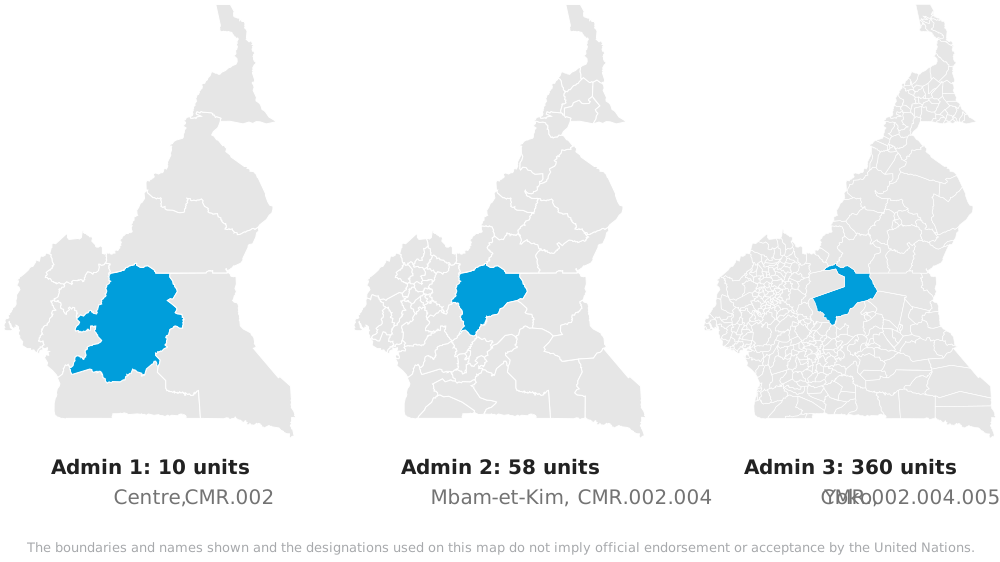
- Admin boundaries form a common operational picture of humanitarian activities, sourced from national authorities if possible
- P-codes: a stable code for every unit, down to the lowest level available
- Maintained by OCHA for the countries where it operates
COD-AB stands for Common Operational Dataset for Administrative Boundaries. In a crisis, everyone responding needs to agree on where the provinces and districts are and what they’re called. The COD-AB is that shared reference, endorsed in-country and published openly. In Cameroon, each P-code extends its parent’s: Yoko is CMR.002.004.005, inside Mbam-et-Kim (CMR.002.004), inside Centre (CMR.002).
OCHA maintains COD-ABs for 114 of 248 countries and territories, including every country with an active humanitarian response plan this year.
HDX: the Humanitarian Data Exchange
- OCHA’s open data platform since 2014, run by the Centre for Humanitarian Data
- 28,000 datasets from 233 organizations
- More than 500,000 users a month
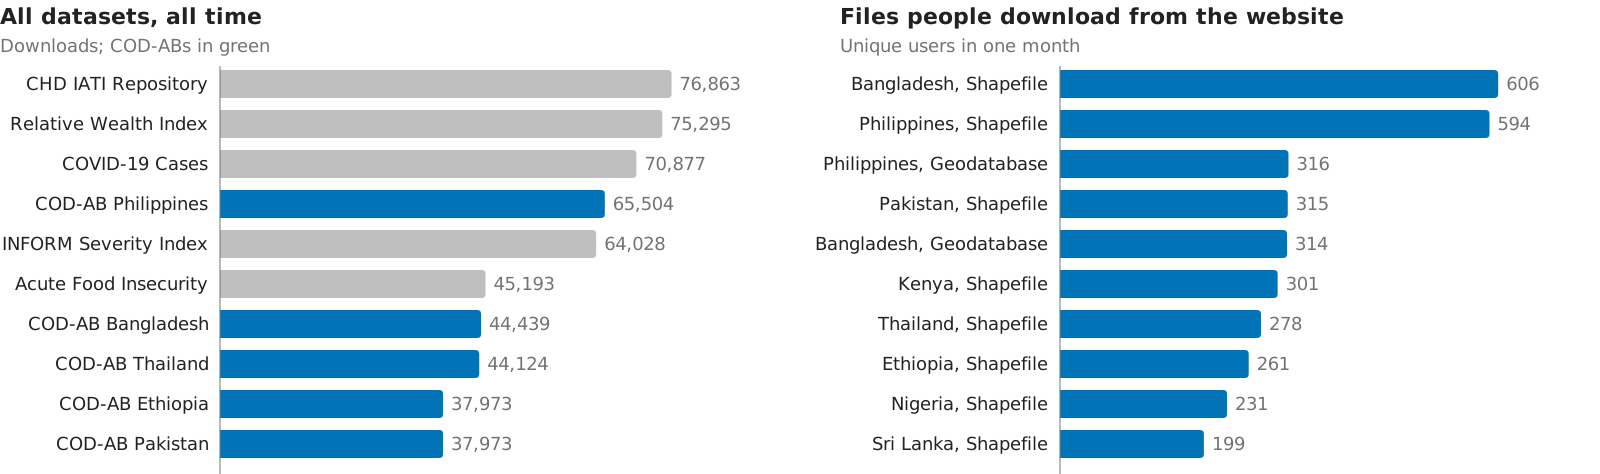
- COD-ABs: less than 1% of datasets, ~10% of downloads
HDX is where organizations share data across crises. Most of its traffic is programmatic: in a month, 555,000 unique users made 1.48 million downloads. The 170 COD-AB datasets account for 1.2 million of its 13.4 million all-time downloads, and five of the ten most downloaded datasets are COD-ABs. About 35,000 users a month browse HDX as people, and when they download from the website, they download boundaries: the ten most downloaded files in a month are all COD-ABs, and eight of the ten datasets with the most notification subscribers are COD-ABs too.
All-time counts are from HDX’s public API in October 2026, and monthly figures from HDX’s September 2026 analytics report. The all-time top ten leaves out a repository of PDF files, which has the most downloads but is a file store, not a dataset.
Boundaries are how people get counted

People in need are counted by district, against a baseline population for that district, and that’s how aid gets targeted. Here it’s Afghanistan in 2025: 22.9 million people in need out of 46 million.
400 of the 401 districts in the needs data join to the COD-AB on their P-code. The one that doesn’t is Khulm, coded AF2110 in the needs data and AF2008 in the boundaries, so a plain join silently drops it.
Each agency keeps its own global boundaries
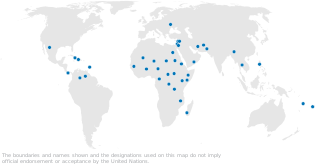
- OCHA, WFP, UNICEF, UNHCR and IOM each maintain one, and so do FAO, the World Bank and others, often for internal enterprise systems
- Their field presence is complementary: they overlap in some countries, and in others only one agency is there
Each dot is a country where OCHA has a country office, a regional office or a humanitarian advisory team. That’s where OCHA has people with local knowledge of the boundaries.
The other agencies each have their own map like this, and their own global boundary dataset built from it. Where they overlap, there are competing versions. Where they don’t, one agency may hold the only good data.
A COD-AB gets built in round trips between field and HQ
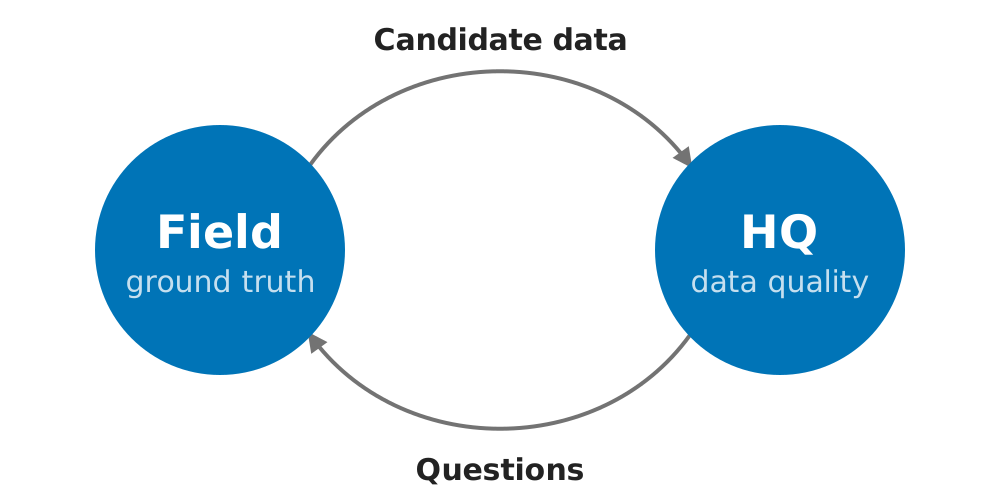
- Field teams know the ground truth: which boundary is correct, how many divisions there are at each level, and what places are called
- HQ knows data quality: cleaning topology, keeping codes and versions consistent, and catching name encoding errors
- A question one side can’t answer goes to the other, and each trip adds friction
Country offices and national agencies know the ground, but the cleaning and coding happen centrally. A dataset needs both, so files go back and forth until it’s right.
UN80 brought the agencies to the same table
- UN80: reform across the UN system to bring efficiency, with one evidence base for humanitarian data
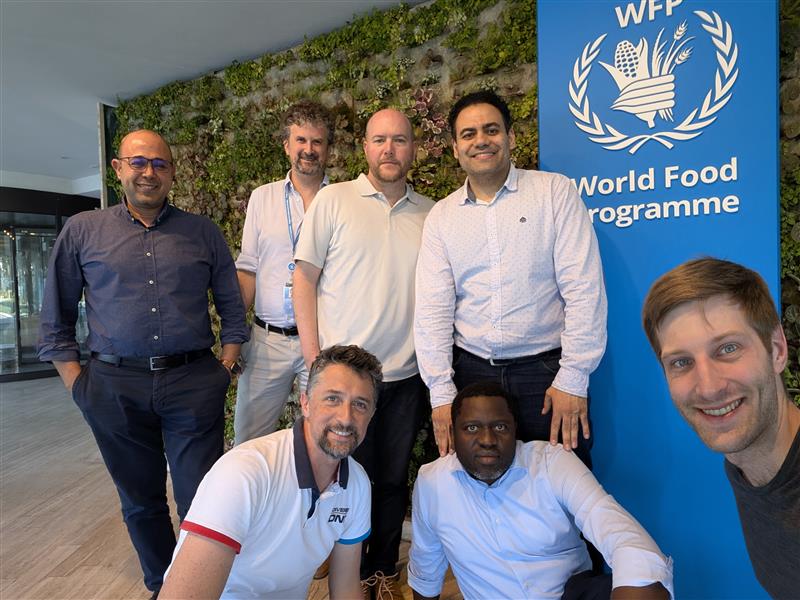
- Rome, June 2026: five UN humanitarian agencies agreed one P-code standard, one update process, and a global COD-AB by the end of 2026
- Then the broader humanitarian community from 2027
UN80 is the reform effort across the UN system. Its report commits to a Humanitarian Data Collaborative so that all actors can work from one evidence base.
For boundaries, that meant getting the five agencies in a room. Over three days in Rome, they agreed the P-code specification, the governance process for updates, and the roadmap. The rollout starts with OCHA’s own process, then the five agencies, then partners like FAO and the World Bank.
A standard only works if it’s easy to follow
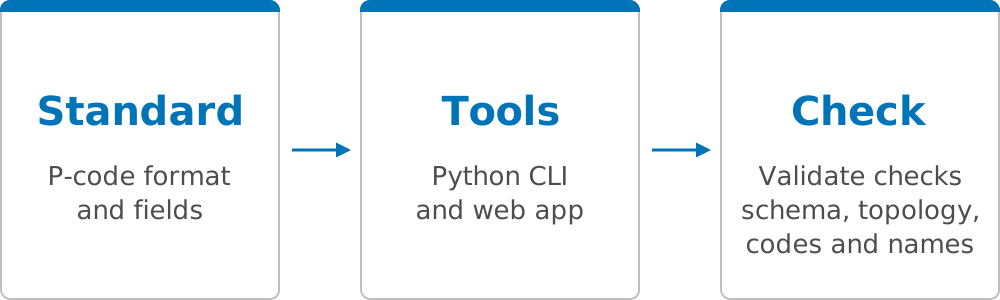
- The tools were built alongside the standard and tested on real COD-ABs while it was still being agreed
- Field teams run the same checks as HQ, so problems are caught before data is sent, with fewer round trips
- Built for staff who don’t use code: everything also runs in a web browser
A standard written only as a document tends to get read once and followed loosely. When the rules are built into the tools people already use, following the standard is simply what the tools do, and the check tells you right away if something’s off.
The tools also use open, widely used formats and P-codes that follow UN Secretariat conventions, so nothing locks partners in.
Building the CLI: tools, then docs, then skills
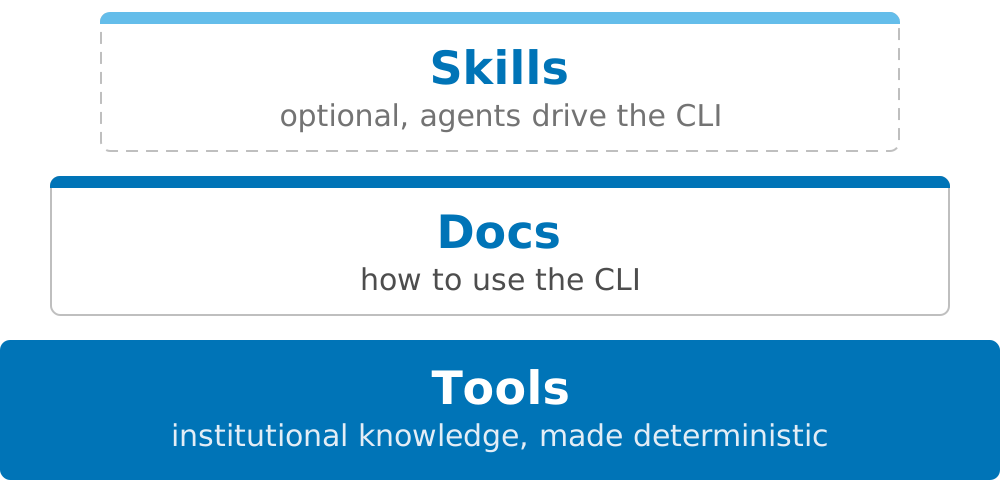
- The CLI commands came first: institutional knowledge made deterministic
- Docs came next: goal-oriented Diátaxis how-to guides, one per step, chained from raw data to release
- Skills came last, so agents can follow the docs and run the CLI
The skills are optional. They open the CLI up to colleagues who are comfortable with data but aren’t software developers. OCHA’s Field Information Services team works this way in VS Code on Windows.
Validated on every COD-AB, then ported to the browser
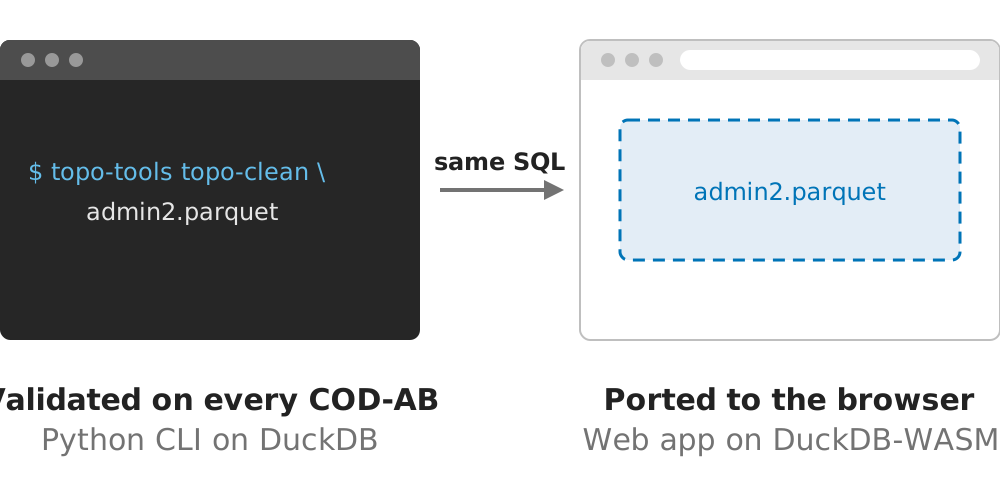
- OCHA converted its COD-AB catalog to a Portolan catalog to test against, then ran every dataset from raw to cleaned
- The hard algorithmic work happens in Python, then ports to JS with the UI added on top, so both stay at feature parity
- Field teams get the same tools HQ uses, in a browser with nothing to install
- Files stay on the local machine, so nothing has to be uploaded over a slow connection
Some partners don’t have Python or an AI subscription, and some can’t install software at all. The browser app is a static site with no server, built with Astro, Svelte and MapLibre. Most of the work went into making the UI easy to use.
The demo uses Netherlands admin boundaries. Each of the next slides embeds one tool, live, with its demo file loaded.