The mechanism at a glance
The trigger is fully forecast-based. SWALIM's river-gauge record is the ground truth the mechanism is calibrated and validated against; it is not a trigger input. Each river basin (Juba, Shabelle) carries one specific trigger per flood season (Gu, rains arriving on the rivers March–May; Deyr, October–December), and each specific trigger is staged:
- Readiness (leads 8–12 days): GloFAS ensemble-median forecast; releases only the small mobilisation share. GloFAS is the only provider whose forecasts reach past 7 days with a historical archive to validate against.
- Action (leads ≤ 6 days): a consensus of (station, model) pairs, drawn only from the five SNRFA gauges still reporting (Belet Weyne, Bulo Burti, Jowhar on the Shabelle; Luuq, Dollow on the Juba; decision 2026-08-26, so every activation is verifiable against a live gauge). Pairs compete freely: the same station may carry two or all three models, and the window's voting pool is every pair within 0.10 ρ of its best pair (4–5 pairs per window). Every pair has its own return-period threshold; the trigger activates when at least N of the pool exceed their thresholds on the same forecast valid day.
| window | action trigger (leads ≤ 6 d) | leg RP | readiness (leads 8–12 d) | readiness RP |
|---|---|---|---|---|
| Juba Gu | Google GRRR ×2 + GloFAS v5 ×2 + GEOGloWS: ≥ 3 of 5 pairs over their 1-in-6-yr thresholds | 6.5 yr | GloFAS ens-median: 2/2 stations over 1-in-2-yr | 3.7 yr |
| Juba Deyr | GloFAS v5 ×2 + GEOGloWS ×2: ≥ 3 of 4 pairs over their 1-in-5-yr thresholds | 26.0 yr | GloFAS ens-median: 2/2 stations over 1-in-2-yr | 4.4 yr |
| Shabelle Gu | Google GRRR ×3 + GloFAS v5: all 4 pairs over their 1-in-6-yr thresholds | 13.0 yr | GloFAS ens-median: ≥ 2/3 stations over 1-in-3-yr | 3.7 yr |
| Shabelle Deyr | GloFAS v5 ×3 + GEOGloWS ×2: ≥ 3 of 5 pairs over their 1-in-5-yr thresholds | 6.5 yr | GloFAS ens-median: 3/3 stations over 1-in-3-yr | 7.3 yr |
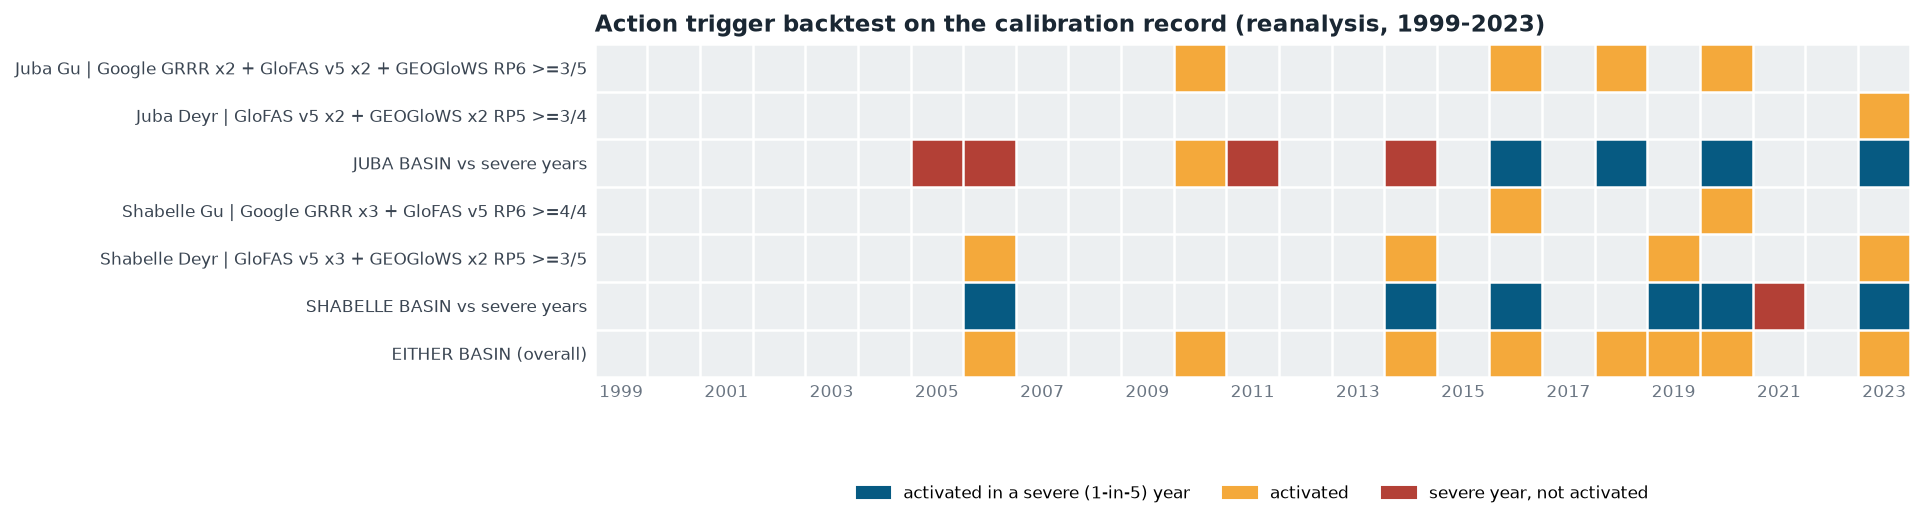
Backtested on 1999–2023, the Shabelle activates 6 of 25 years (1-in-4.3) and the Juba 5 (1-in-5.2), near-equal by construction (the two basins are now calibrated jointly: activation counts may differ by at most one, and the either-basin union must stay at ≥ 3 years). At least one basin activates in 8 years, overall return period 3.2 years, meeting the ≥ 3-year specification. The activation years are 2006, 2010, 2014, 2016, 2018, 2019, 2020 and 2023, every one at least a 1-in-3 flood year at the reference gauges (zero activations outside the moderate benchmark set). Per-basin thresholds are nominal; the final adjustment belongs to the framework working group.
Backtested on 1999–2023, both basins activate 6 of 25 years (1-in-4.3, exactly equal) and at least one activates in 7, overall return period 3.7 years, still meeting the ≥ 3-year specification with room to spare. The activation years are 2005, 2010, 2016, 2018, 2019, 2020 and 2023, again all within the 1-in-3 gauge benchmark set. So the headline answer is yes, a workable mechanism survives without Google, but see what it costs, below.
What happens without Google Flood Hub
Google Flood Hub is the only provider here without a public inter-agency commitment behind it, so the working group asked what the mechanism looks like if it disappears. The switch at the top of this page recalibrates the entire report, not by deleting Google's votes from the adopted configuration, but by re-running selection, the RP × N grid and the joint basin calibration from scratch over GloFAS v5 + GEOGloWS only. Side by side:
| adopted (three providers) | variant (no Google) | |
|---|---|---|
| Overall RP | 1-in-3.2 (8 yrs) | 1-in-3.7 (7 yrs), still meets spec |
| Per basin | Shabelle 1-in-4.3, Juba 1-in-5.2 | both 1-in-4.3 (exactly equal) |
| Severe-year coverage | Juba 4/8, Shabelle 6/7 | Juba 5/8, Shabelle 4/7 |
| False activations | 0 | 0 |
| Smallest pool | 4 pairs (Shabelle Gu) | 1 pair (Shabelle Gu, no consensus at all) |
| Windows changed | none | both Gu legs rebuilt; Juba Deyr identical; Shabelle Deyr retuned (same pool, new RP/N) |
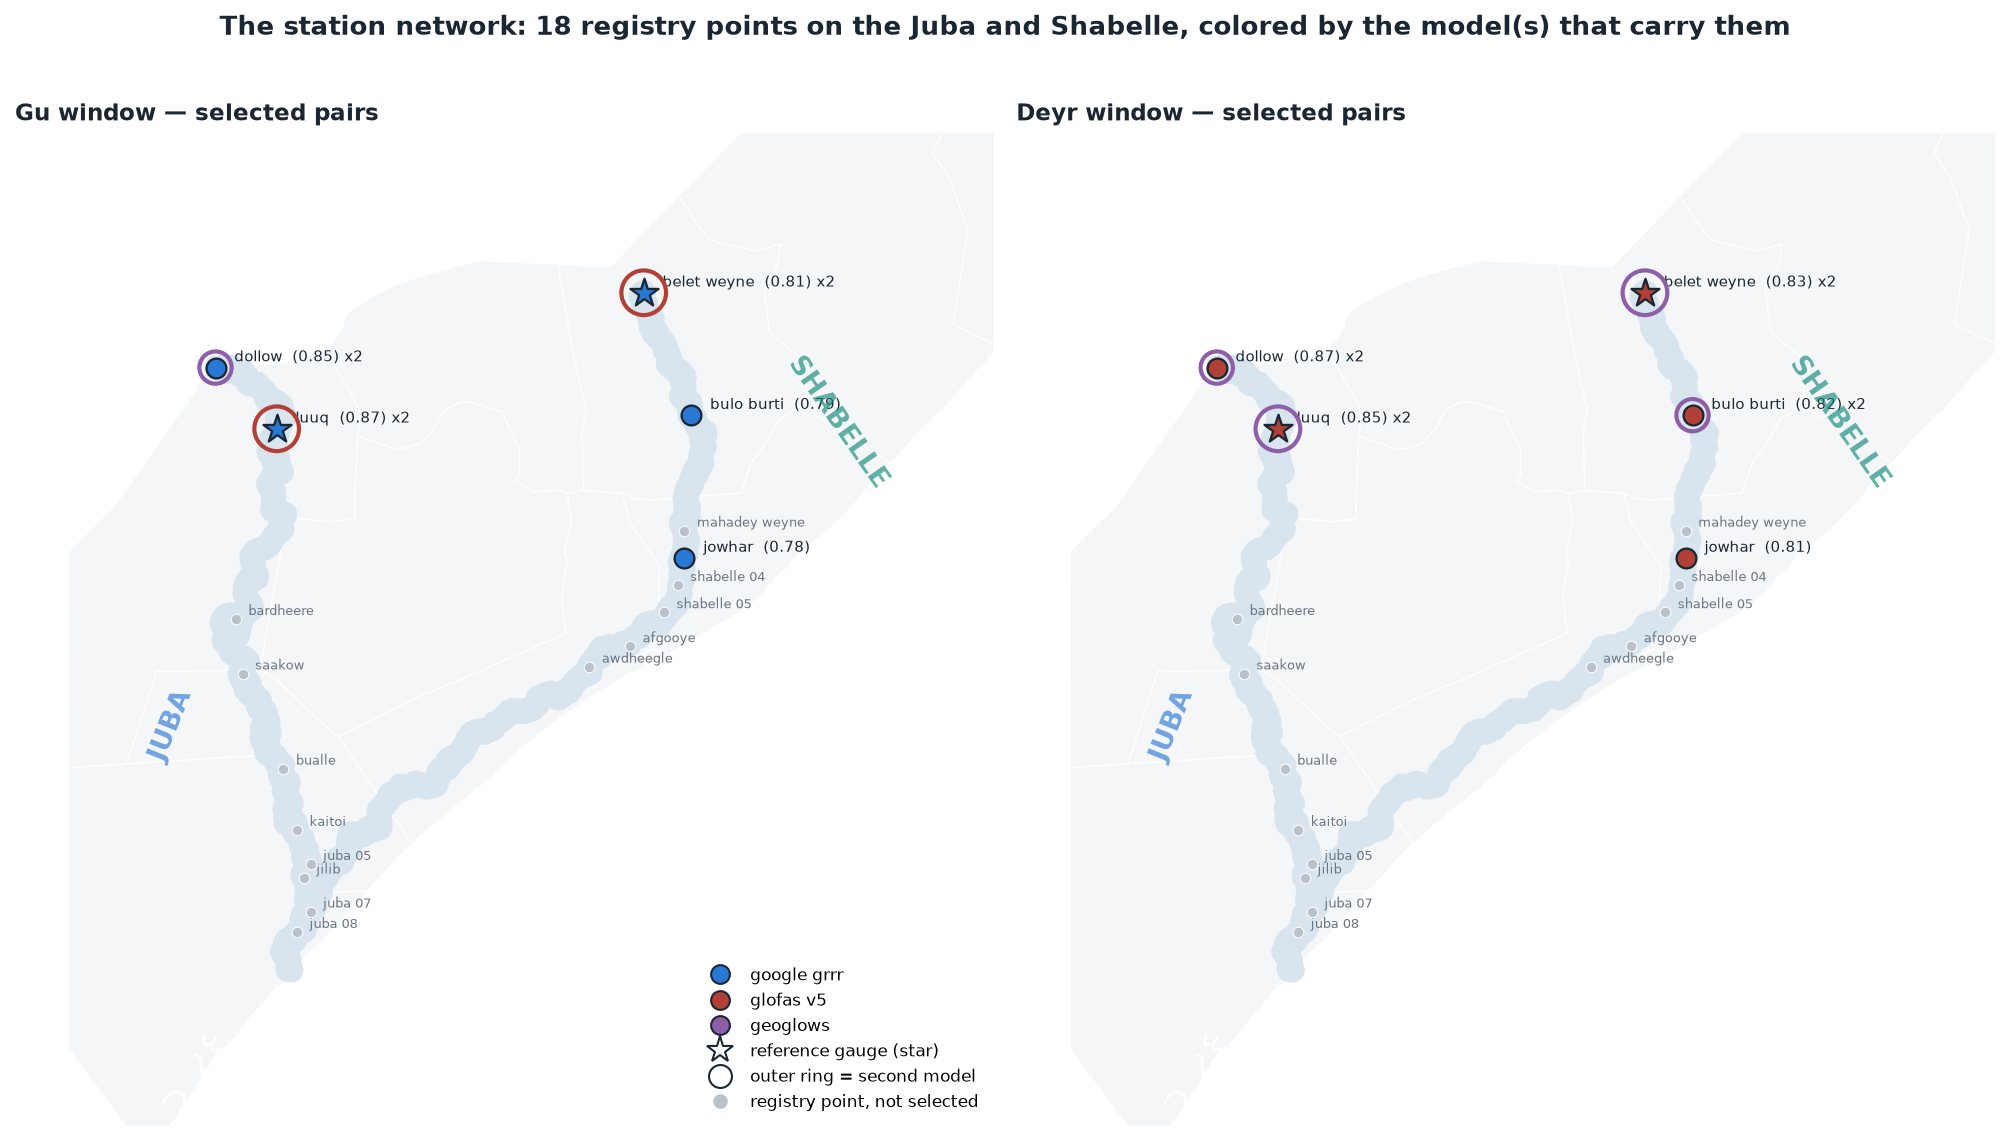
How the pairs were chosen
Every combination of the five active SWALIM gauges and the three providers competes on one metric: best-lag Spearman rank correlation between the provider's reanalysis/retrospective discharge and the SWALIM reference-gauge level (Belet Weyne for the Shabelle, Luuq for the Juba), per river and season, the correlations computed in P. Wairimu's notebook 06, against the SWALIM benchmark her notebook 01 established (post-2000 record, official Moderate/High risk levels) and her notebook 05 showed must be primary over FloodScan on the Shabelle. Pairs compete freely (decision 2026-08-25: the goal is the best forecasts on the right basin, and a station may carry two models), under three rules, none of which knows what a model is:
- Active-gauge restriction (decision 2026-08-26): candidates are the SNRFA gauges still reporting: Belet Weyne, Bulo Burti and Jowhar on the Shabelle, Luuq and Dollow on the Juba (Bardheere's record stops Nov 2023, Bualle's Mar 2024; the rest died decades ago). Ungauged river points, several of which score higher ρ, are out: an activation must be checkable against an observation, live, at the point the forecast speaks for.
- Timing guard: pairs whose signal trails the reference gauge by more than 3 days are excluded; a ≤ 6-day trigger cannot spare that anticipation.
- Relative quality floor: the voting pool is every qualifying pair within 0.10 ρ of the window's best pair. No fixed count and no diversity quota: with 25-year records, pairs that close are statistically interchangeable, so all of them get a vote. Pool sizes come out at 4–5 pairs per window (from 15 candidate pairs: 5 gauges × 3 providers).
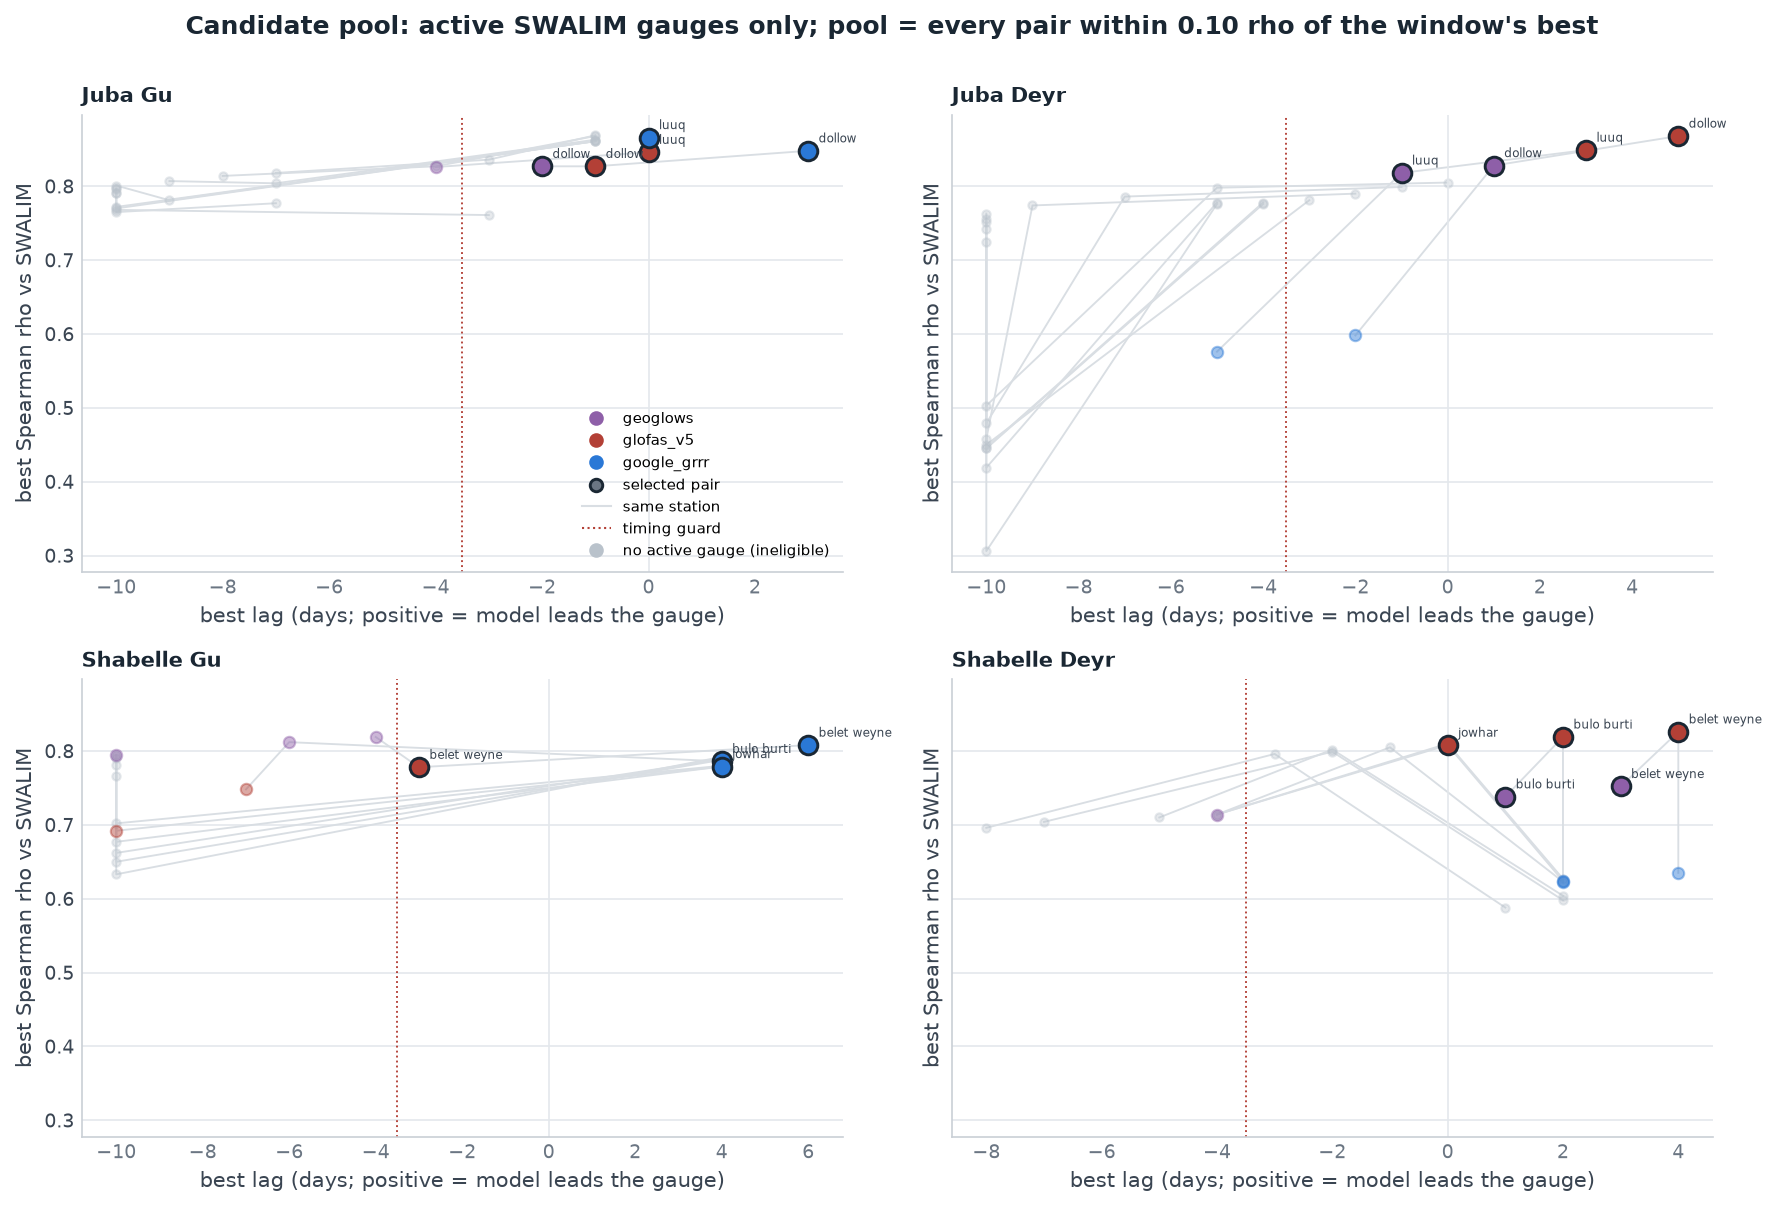
Multi-model representation is earned, not injected: GEOGloWS clears the floor in three of the four windows: Juba Deyr (Dollow ρ 0.83 at +1 d and Luuq 0.82, ahead of both Google pairs), Juba Gu (Dollow 0.83, floor 0.77) and Shabelle Deyr (Belet Weyne 0.75 and Bulo Burti 0.74, floor 0.73). In Shabelle Gu it has no pair passing the timing guard (−4 to −10 d) and stays out, as does every GloFAS pair there except Belet Weyne (−3 d, exactly on the guard), which is why that window is Google-heavy. An earlier draft used an explicit diversity rule to the same effect; it proved unnecessary and was dropped. The full per-station numbers (greyed rows = no active gauge):
Per-station selection detail (ρ / lag per model, all four windows)
Seasonal peaks: model vs gauge
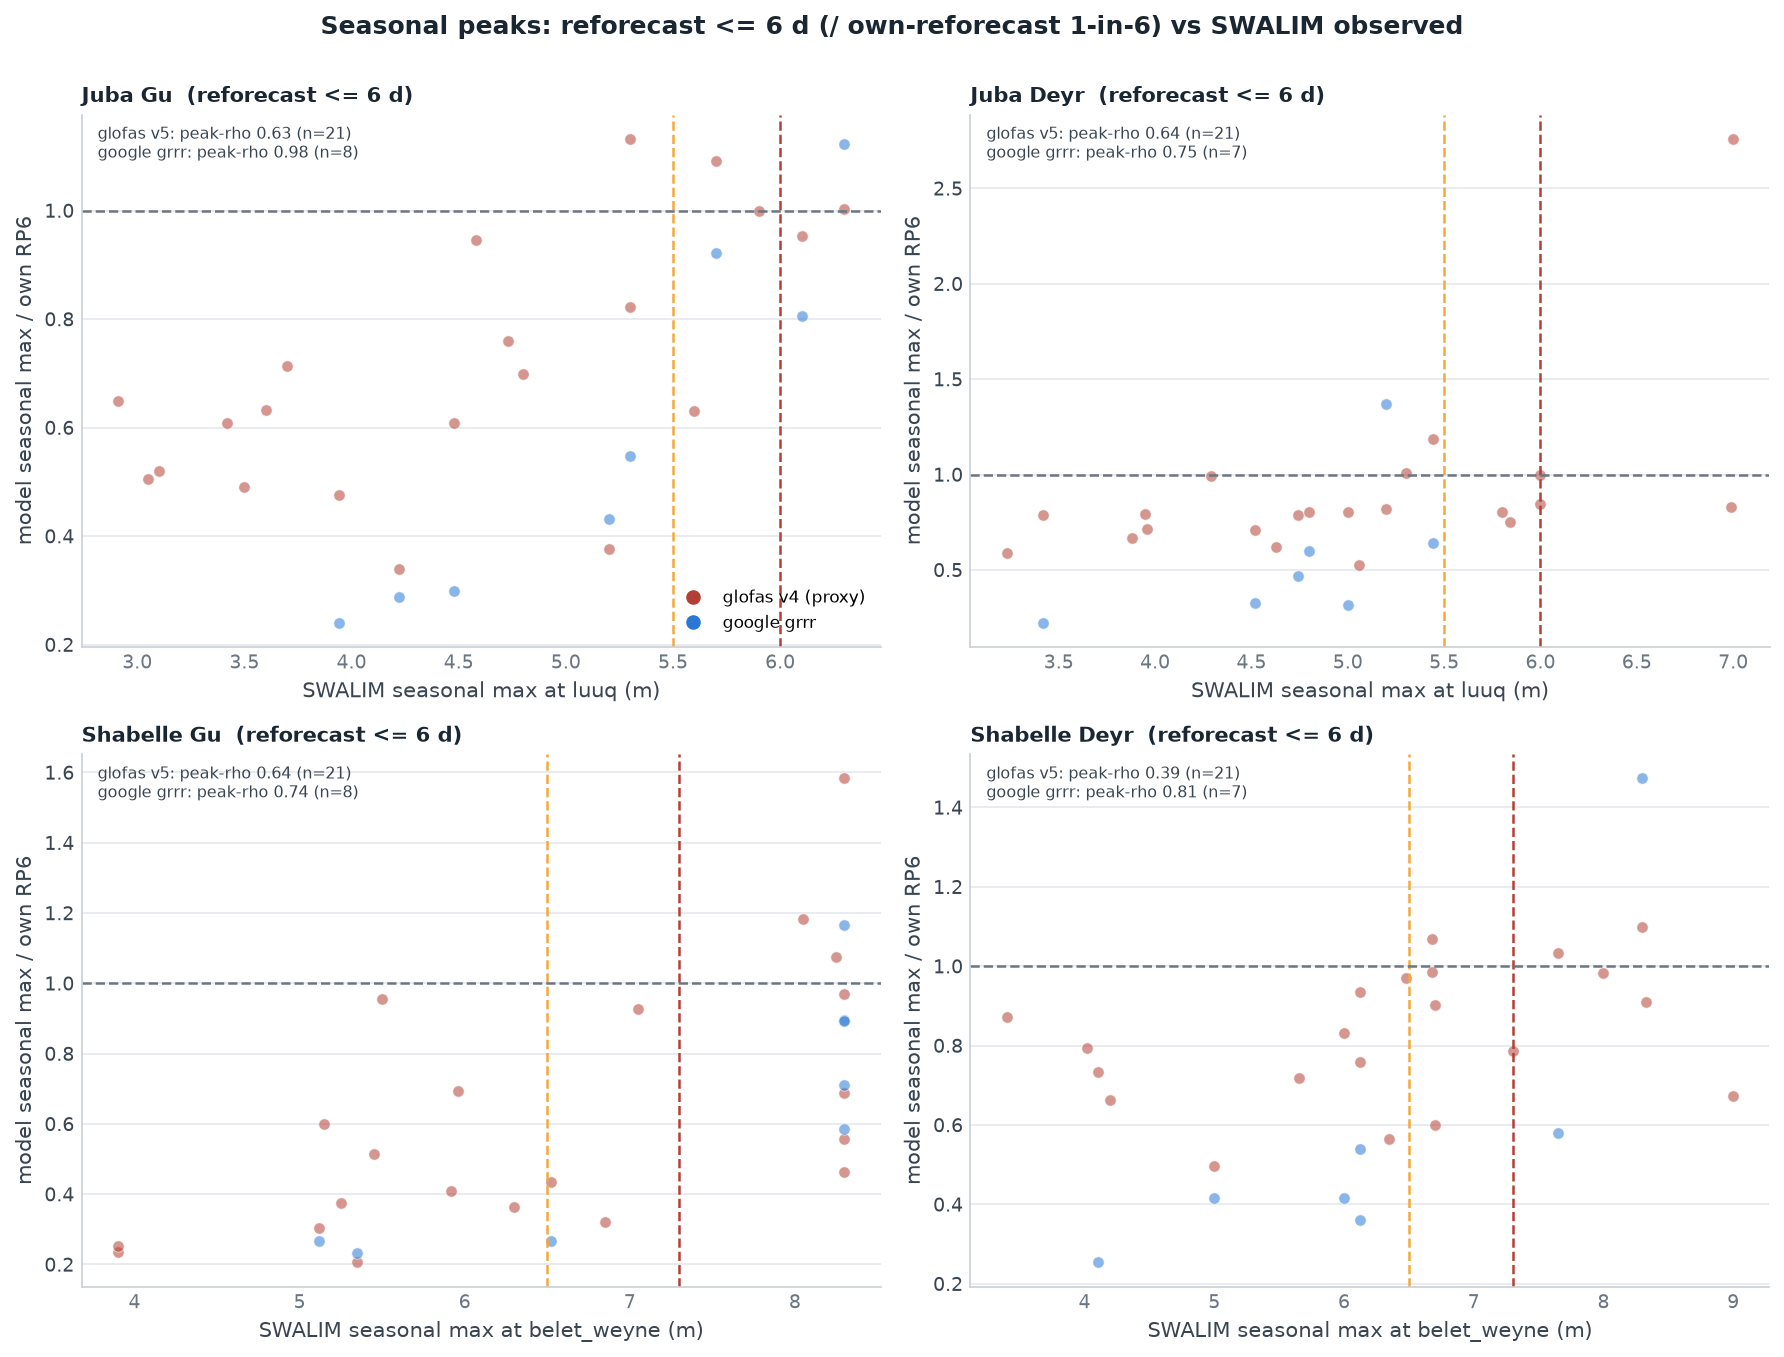
Daily rank correlation can flatter a model that merely tracks the seasonal cycle. The sharper diagnostic is one point per season-year: the model's seasonal peak against the observed seasonal peak at the reference gauge, which shows whether the model ranks the years in the right order. For display each model's peak is divided by its own 1-in-6 threshold (rank correlation is unaffected by the normalisation), so the quadrants read directly: top-right = the model ran over its own threshold in a year the gauge also ran high.
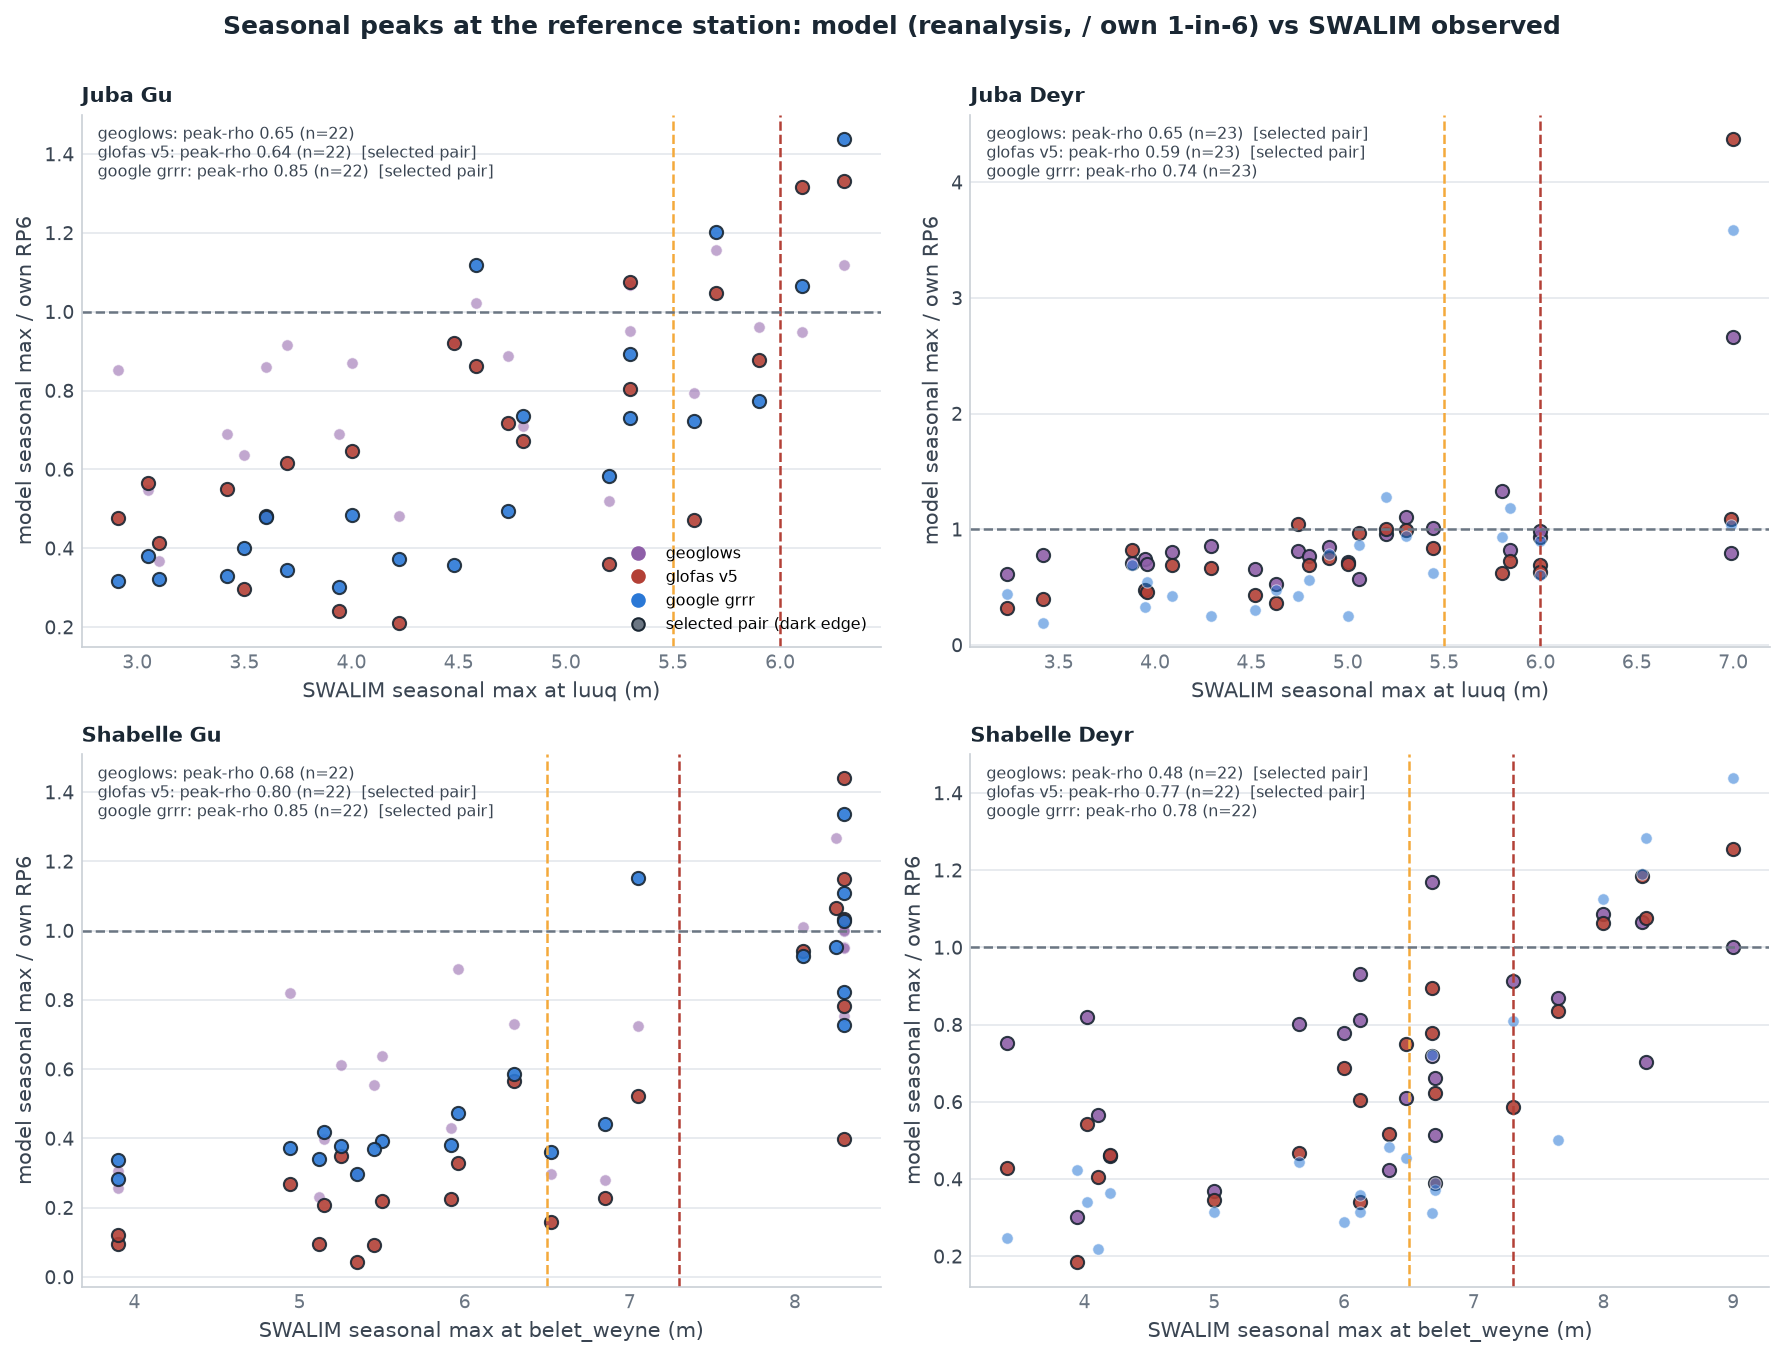
| window | peak Spearman ρ, reanalysis (n = 21–25) | peak ρ, reforecast ≤ 6 d | |||
|---|---|---|---|---|---|
| GEOGloWS | GloFAS v5 | Google GRRR | GloFAS v4 (proxy) | Google GRRR | |
| Juba Gu | 0.65 | 0.64 | 0.85 | 0.63 | 0.98 |
| Juba Deyr | 0.65 | 0.59 | 0.74 | 0.64 | 0.75 |
| Shabelle Gu | 0.68 | 0.80 | 0.85 | 0.64 | 0.74 |
| Shabelle Deyr | 0.49 | 0.77 | 0.78 | 0.39 | 0.81 |
Does the selection metric matter? Daily ρ vs peak ρ vs lead time
Nigeria's recipe: select on daily wet-season lag-optimised Spearman ρ, use annual-peak ρ and peak-timing offset as post-selection guards, and let lead time enter through the reforecast checks rather than the selection score. Here the question was put to the data directly: every candidate pair scored on both metrics, and the full pool → grid → basin calibration re-run under three selection rules: daily-ρ floor (adopted), peak-ρ floor, and their mean, each with the same timing guard.
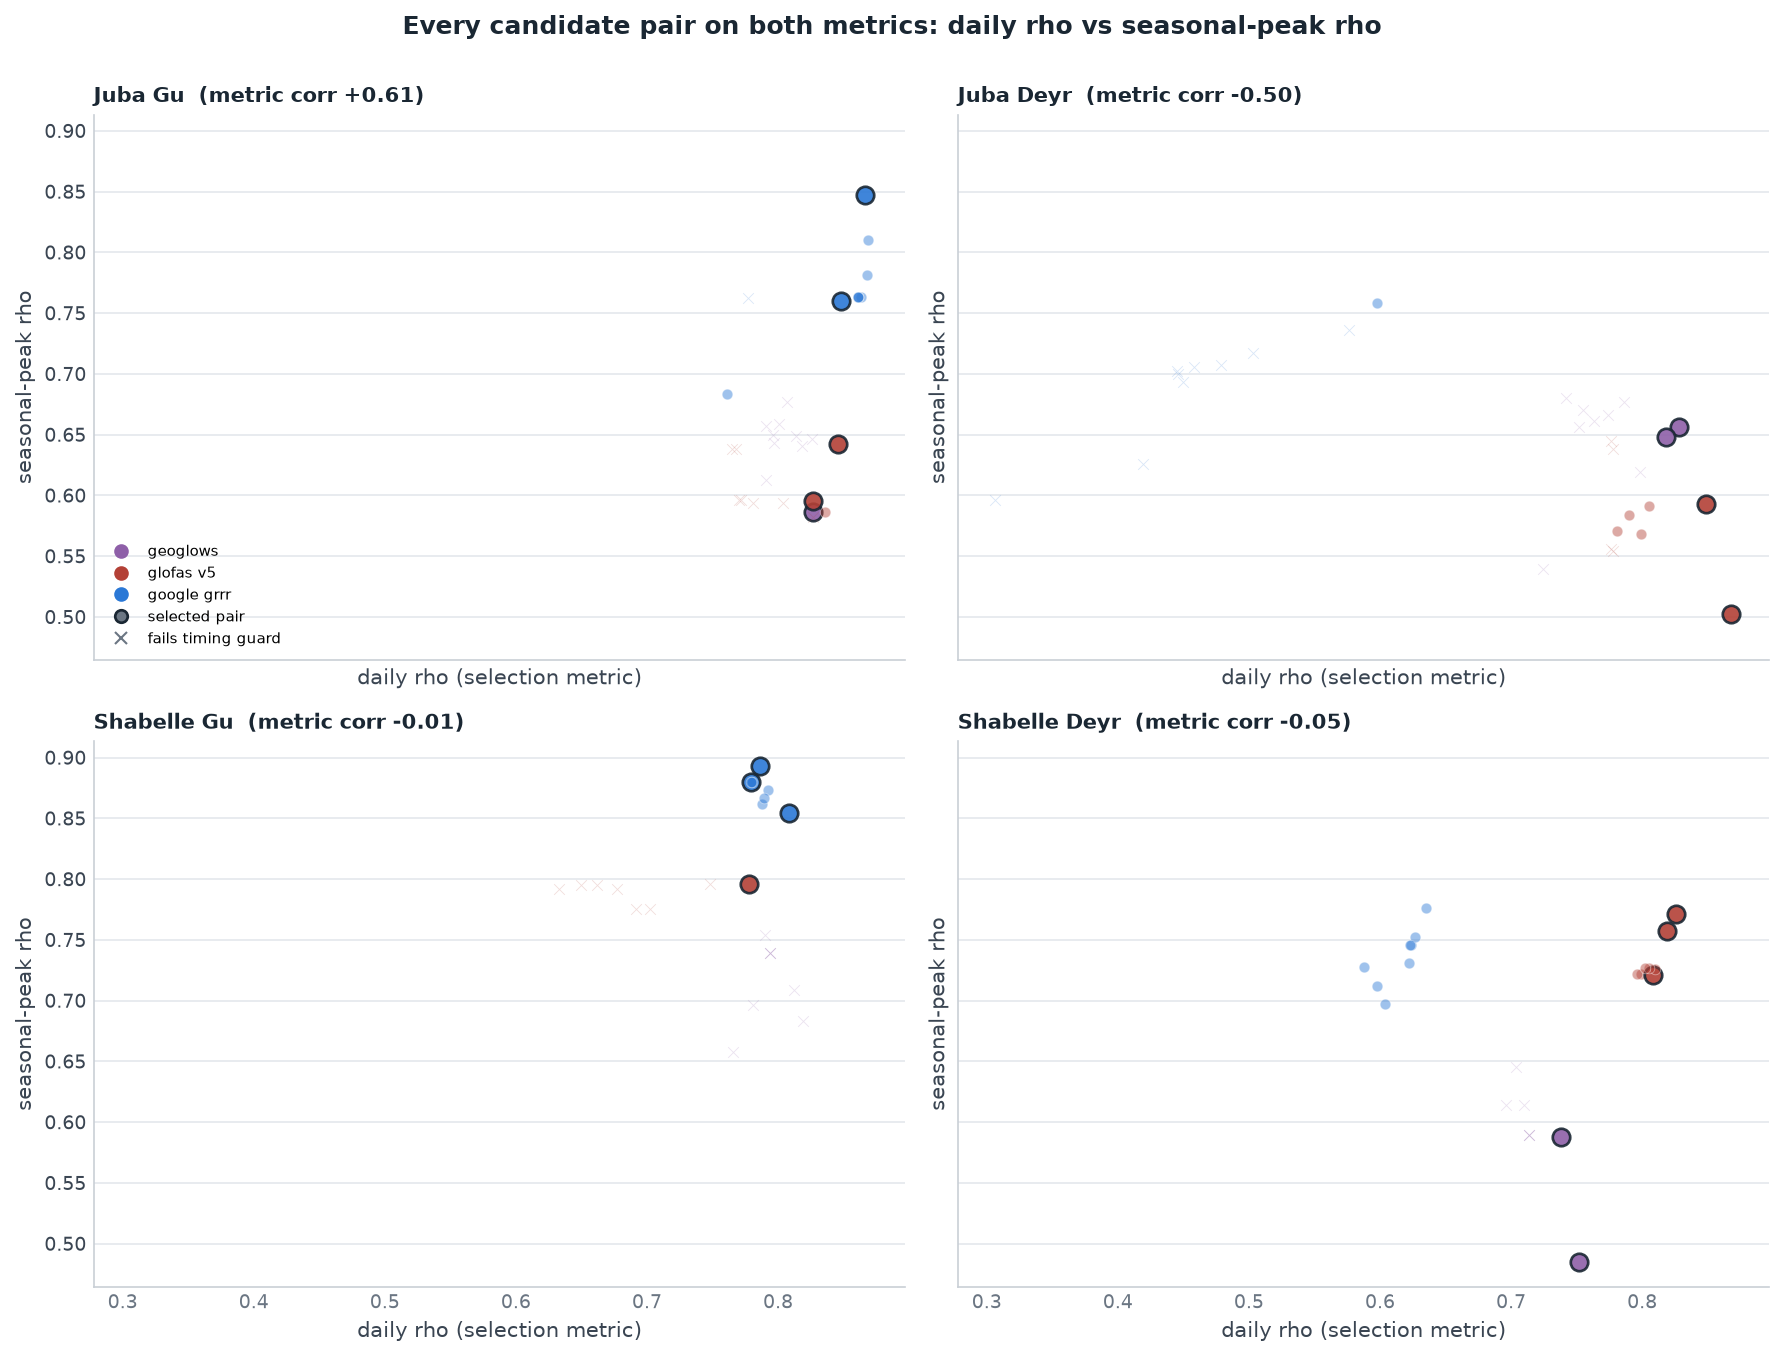
som_ms_metric_robustness). With the
active-gauge restriction the pools are 4–5 pairs, so a metric change that
reshuffles one pair can move one marginal year; under the previous 8–12-pair pools the three metrics were exactly identical. Daily ρ stays as the primary
metric because it is the far more stable estimator (~2,000 daily observations
against ~22 annual peaks, where a single flood year moves peak-ρ by ~0.1);
peak-ρ is published per pair as a diagnostic (figure above and the
som_ms_pair_metrics table), and lead time is already in the design twice: the −3-day timing guard at selection, and the reforecast backtests at
the operational lead bands. A composite score was considered and rejected: it
would add a tunable weight to arbitrate a single marginal year.
Thresholds and calibration
Each selected pair gets its threshold from its own model's climatology: the Weibull plotting position of its seasonal maxima (1999–2023) at the target return period. Magnitude bias between models cancels out: each pair is equally likely to exceed its threshold by construction. The same principle carries into operations: we assume bias between reanalysis and forecast for every source (quantified in the next section), so a threshold is only ever applied to the product whose own historical values it was fitted on. To inspect the indicators themselves, year by year, use the indicator explorer. The basin-level search then chooses, per season, the per-pair return period and the consensus count N, with the two basins picked jointly: per-basin activation counts of 4–6 differing by at most one (near-equal probability), the either-basin union at ≥ 3 years overall (the specification, enforced rather than hoped for), maximum coverage of the basins' severe (1-in-5) benchmark years, fewest activations outside the moderate (1-in-3) benchmark set, and, among ties, the more frequent option.
The tuning surface
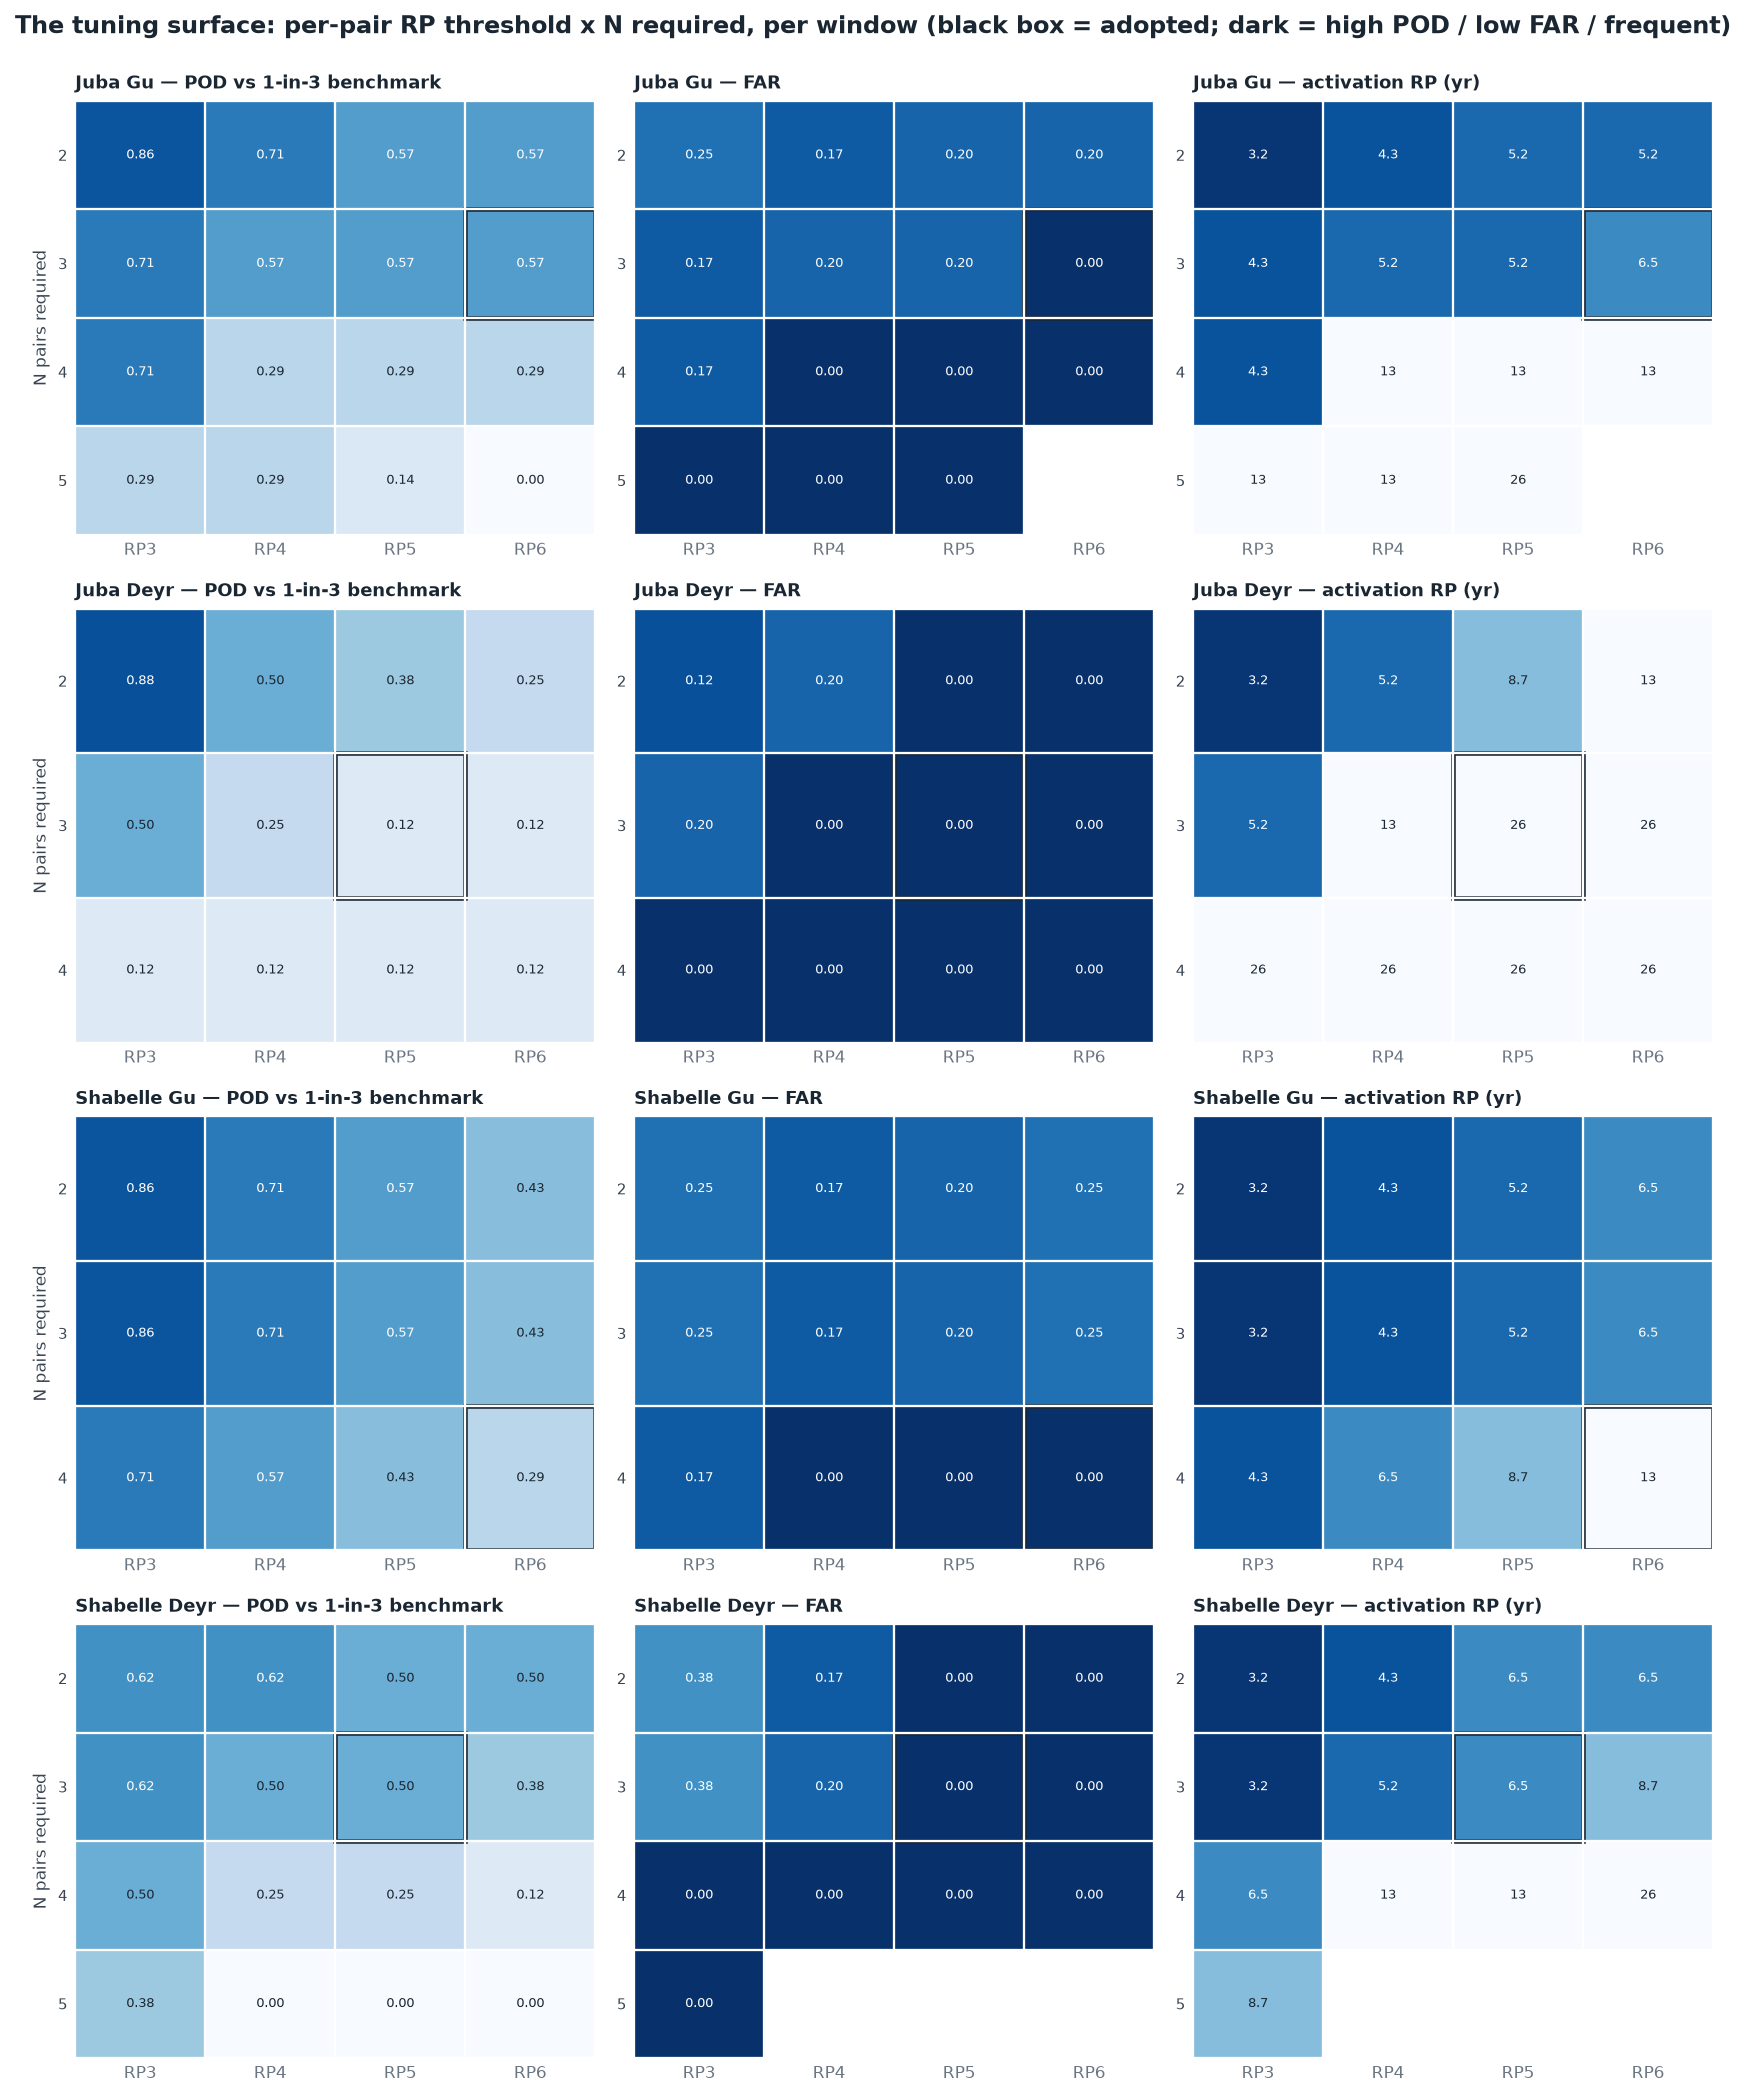
The Nigeria-style grid search (per state there; per basin and season here, the same recipe as P. Wairimu's notebook 08): every (per-pair RP threshold, N pairs required) cell is scored against the seasonal SWALIM benchmark. The adopted cell is not always the best single-window score: it is the best choice subject to the basin-level constraints (near-equal per-basin frequency across the Gu+Deyr union, severe-coverage-first, ≥ 3-yr overall enforced jointly across the basins). With 4–5-pair pools the surface is small enough to read whole: the neighbors show what loosening a leg would cost in false activations, or tightening one in missed severe years.
Are SWALIM's official flood-risk levels trustworthy?
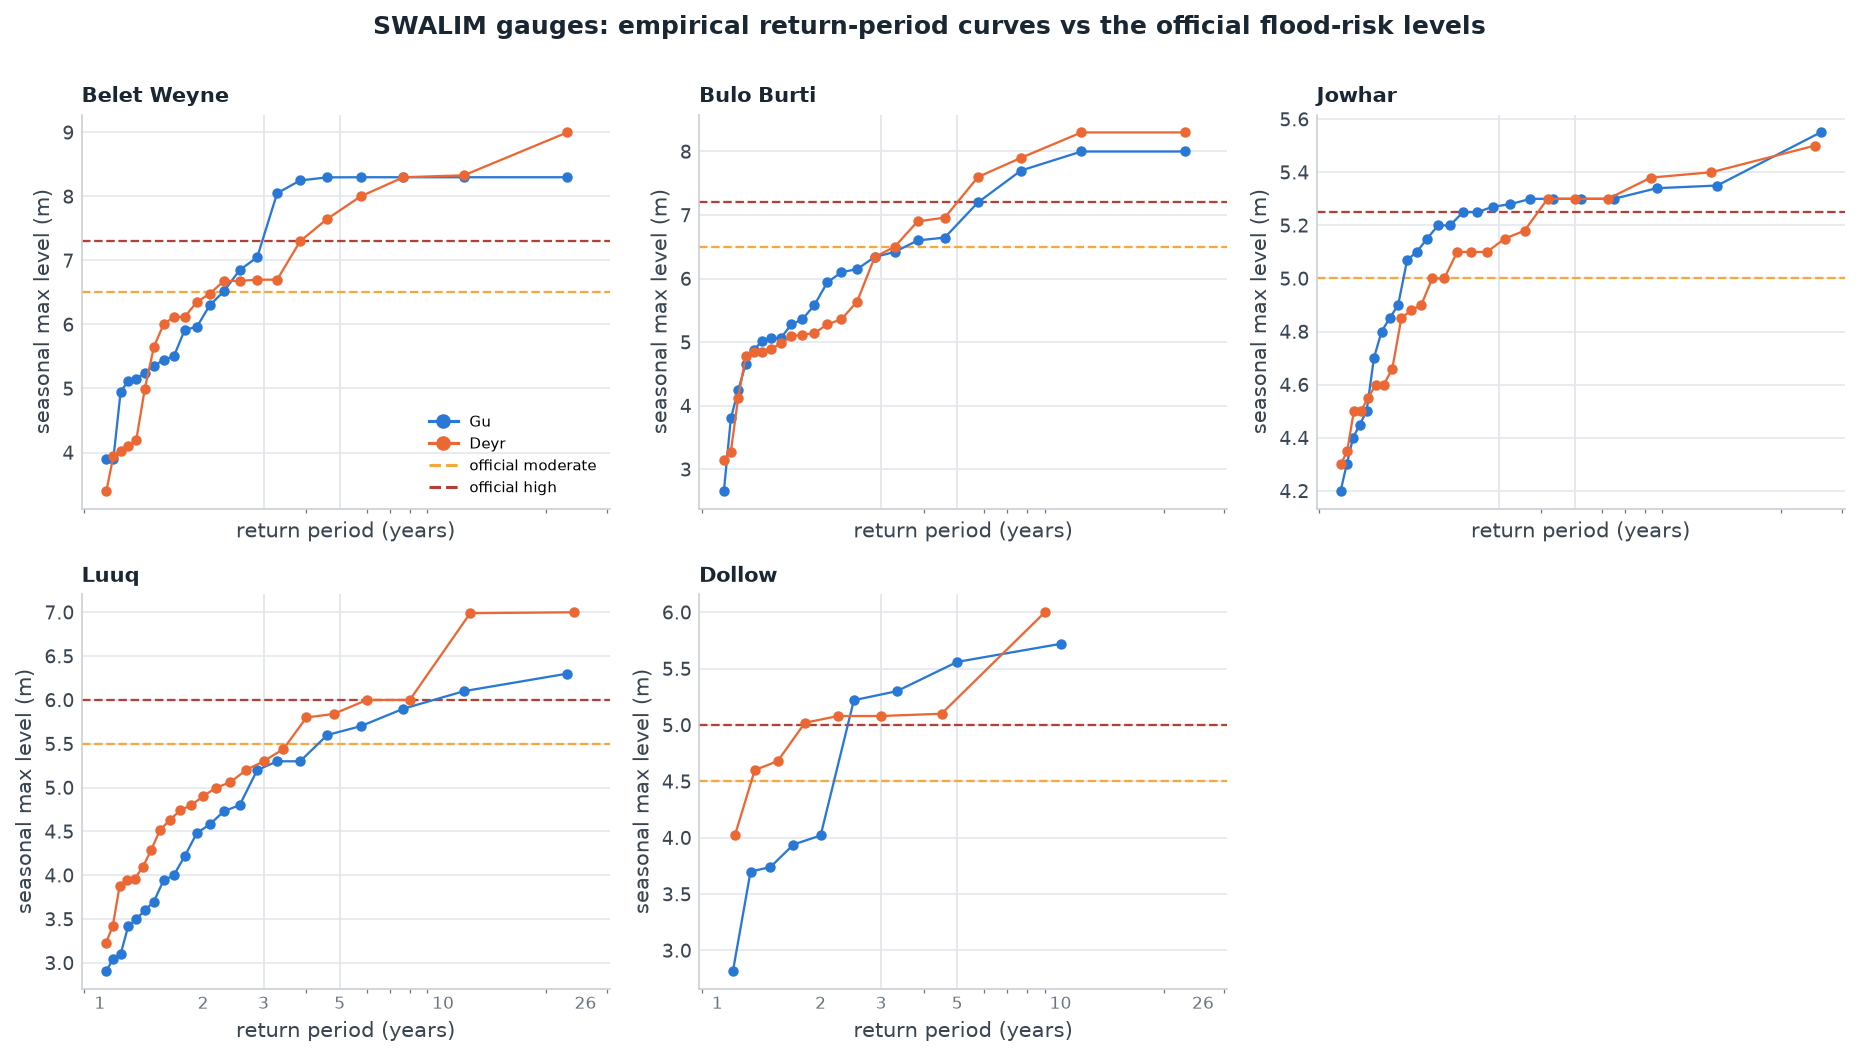
The benchmark years above are defined by empirical return periods of the
gauges' own seasonal maxima, not by SWALIM's published moderate and high flood-risk levels. The check below is why. Putting the official levels on the
empirical RP scale (per active gauge and season, 1999–2023) shows they imply wildly
inconsistent frequencies: "Moderate" ranges from a level the river reaches most
years (Dollow Deyr, ~1-in-1.3; Jowhar Gu, ~1-in-1.6) to a genuinely rare one (Luuq
Gu, ~1-in-4.6), and "High" from ~1-in-1.8 (Dollow) to ~1-in-11.5 (Luuq Gu). They
are engineering levels of uncertain provenance, rather than a consistent severity scale, the same conclusion P. Wairimu's notebook 01 flagged when the published
max_level at Belet Weyne came out below its bank-full level.
Everything in this mechanism therefore runs on each gauge's own empirical RP3/RP5
levels (table som_ms_swalim_rp); the official levels remain useful
only as familiar reference lines for readers of SWALIM bulletins.
Forecast skill against each model's own reanalysis
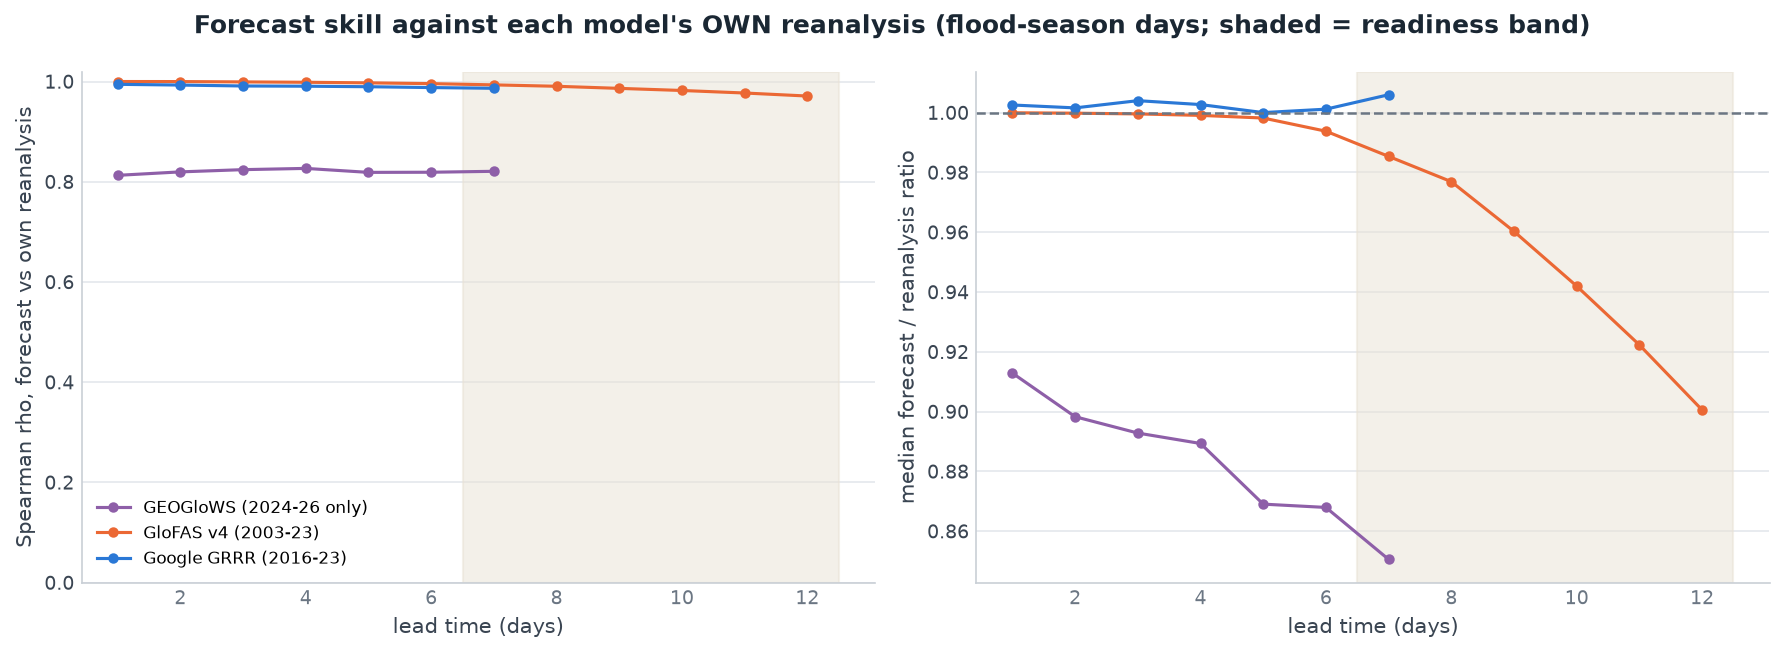
The assume-bias-for-all-sources rule, quantified: per model and lead time, how well the forecast reproduces the model's own reanalysis or retrospective, by rank correlation (whether it tracks itself) and the median forecast-to-reanalysis ratio (whether it is biased against its own climatology). Computed per station on flood-season days, median across the 18 stations.
Would it have worked operationally?
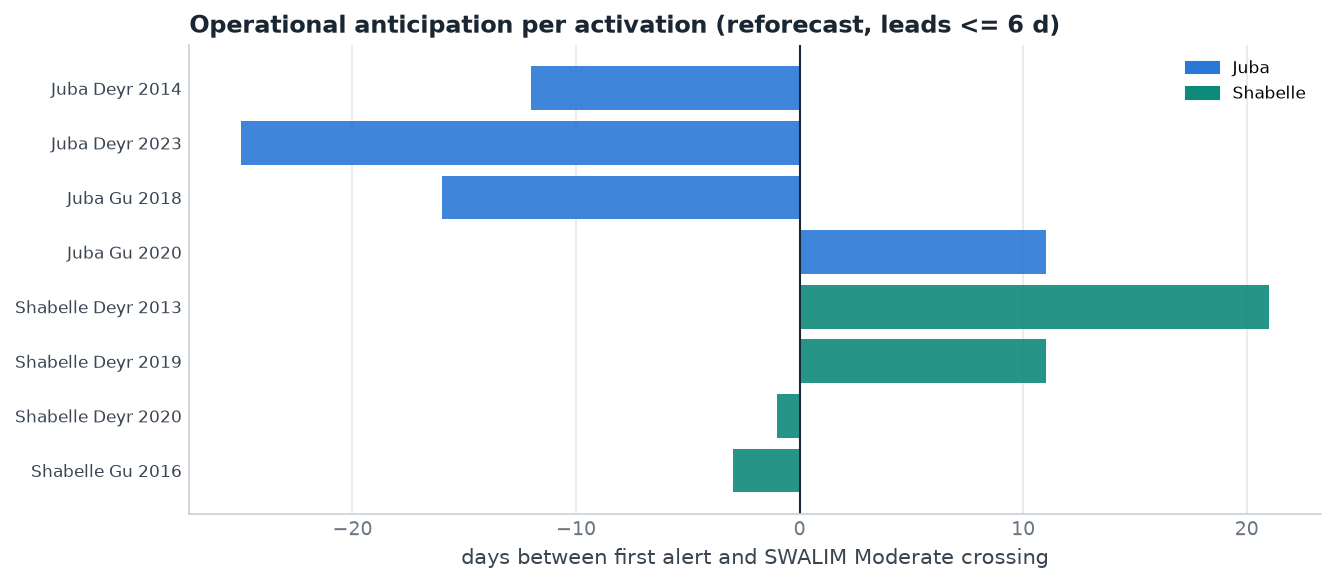
The calibration record is reanalysis, a model's afterwards-view of its own past. The operational test replays the historical forecasts: per pair and valid day, the most alarming ≤ 6-day signal (max over issue dates; with mixed providers in one window, a monitoring day combines each provider's latest forecast). Google pairs use their own reforecast (2016–2023); GloFAS v5 pairs the v4 reforecast (2003–2023, ensemble median, thresholds refit on v4's own climatology, since no v5 reforecast exists); GEOGloWS pairs the retrospective as a lead-0 stand-in (hindsight, flagged per window). That forecast skill barely decays from lead 1 to 7 on these slow rivers, where the flow is driven by initial conditions, is P. Wairimu's notebook 03 finding, and is what makes both lead bands viable at all.
| window | archive | stand-in pairs | reproduces calibration years? | notes |
|---|---|---|---|---|
| Juba Gu | 2016–2023 | 1 | 2/3: 2018, 2020; misses 2016 | near-clean |
| Juba Deyr | 2003–2023 | 2 | 1/1: catches 2023 (25 d after the Luuq Moderate crossing) | over-fires: adds 2014, 2015 (about 1-in-7 vs the calibration's 1-in-26); see below |
| Shabelle Gu | 2016–2023 | 0 | 1/2: catches 2016 (−3 d); misses 2020 | fragile: the all-4-pairs rule leaves no slack on forecasts; see below |
| Shabelle Deyr | 2003–2023 | 2 | 1/4: catches 2019 (+11 d); misses Deyr 2023, 2014, 2006; adds 2013 (+21 d) and 2020 (−1 d) | the weak window; see the caveat below |
The readiness leg (8–12 days)
GloFAS ensemble-median forecasts at leads 8–12 days (the leads-8-12 reforecast was downloaded specifically for this band; the readiness figures in this section were computed with lead 7 of the leads-1-7 archive included, as notebook 11 does), over each window's distinct stations (just 2 on the Juba, 3 on the Shabelle now), thresholds on GloFAS v4's own climatology, at a lower bar: readiness releases only the mobilisation share and may activate more often than action. It fully covers the action years for Juba Gu, Juba Deyr and Shabelle Gu at 1-in-3.7–4.4 frequencies, unchanged in the no-Google variant, since readiness was always GloFAS-only; only the required station counts relax (1-of-2 on the Juba, 1-of-1 on Shabelle Gu) to match the variant's smaller action pools. Shabelle Deyr readiness covers 2 of 4 action years: at 8–12 days GloFAS v4 cannot see Deyr-2023-type events at all. Individually the readiness legs sit at 1-in-3.7–7.3, but their union runs about 1-in-1.8; the working group should see that number explicitly when deciding the mobilisation share.
Return-period bookkeeping
| level | trigger | activations (1999–2023) | RP |
|---|---|---|---|
| individual | Juba Gu action | 4: 2010, 2016, 2018, 2020 | 6.5 yr |
| individual | Juba Deyr action | 1: 2023 | 26.0 yr |
| individual | Shabelle Gu action | 2: 2016, 2020 | 13.0 yr |
| individual | Shabelle Deyr action | 4: 2006, 2014, 2019, 2023 | 6.5 yr |
| basin | Juba (Gu or Deyr) | 5 | 5.2 yr |
| basin | Shabelle (Gu or Deyr) | 6 | 4.3 yr |
| overall | action, either basin | 8 | 3.2 yr |
Under all-in funding (the full envelope on any activation, the working assumption in the evidence deck) the effective RP equals the overall RP, 3.2 years. A split structure would raise the effective RP above it; that is a framework-team decision.
Activations, impact and response, year by year
The two-historical-records rule: the trigger record against impact, not just the hazard benchmark. Everything is grouped basin → season, reverse-chronological. The trigger column is the trigger's actual decision variable: the peak number of (station, model) pairs simultaneously over their thresholds that season-year. The cell fills red when it meets the requirement shown in the season header (= the trigger activates). RP is the empirical return period of that season's maximum level at the SWALIM reference gauge: 5yr = a 1-in-5-year level or higher, 3yr = 1-in-3 to 1-in-5 (Weibull on the gauge's own seasonal maxima, per the threshold check above, not the official flood-risk levels); EM-DAT (purple) is people affected and CERF (blue) the flood allocation (US$), shaded by magnitude, each attributed to the basin(s) named in the event or allocation narrative.
| loading… |
Attribution & caveats. EM-DAT is a floor (entry-criteria bias), split to seasons by start month (Mar–Jun → Gu, Sep–Dec → Deyr); an event naming both rivers is counted under both basins (not split; hover for deaths and the multi-basin flag); events naming neither river (mostly flash floods elsewhere) are excluded. A CERF allocation naming neither river in its narrative is shown under both basins and marked * (they are national riverine-flood responses). Impact columns are context, not a skill score: a formal skill-vs-impact statistic still requires choosing an impact threshold.
Should impact tilt the probabilities?
Near-equal per-basin probability is a design choice, not a law; a basin or season carrying systematically more impact could get a lower relative threshold. Aggregating the basin-attributed records (1999–2023) answers whether the data call for it:
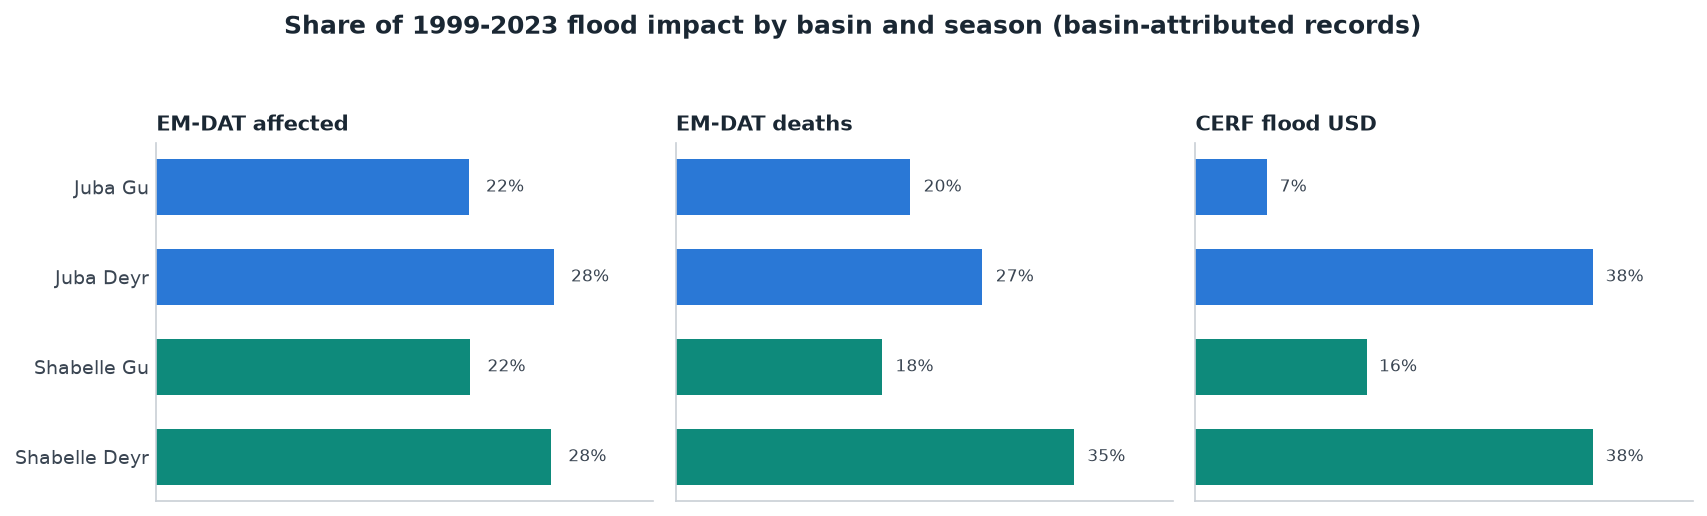
som_ms_impact_by_window). Basin totals are near-equal (Juba 47%, Shabelle 53% on the three-record average) but the seasons are not:
Deyr carries ~65% of impact (and the two largest CERF flood
allocations) against Gu's ~35%.Re-running the calibration with the activation budget allocated by impact share
instead of equally (table som_ms_impact_tilt) makes the conclusion
concrete:
- A basin tilt changes nothing. The 47/53 split rounds to the same 5/6 activation allocation the joint calibration already adopted; the adopted mechanism's slight Shabelle lean is already impact-consistent.
- A season tilt is possible but costs skill. Pushing Juba's budget toward Deyr (its higher-impact season) forces its Deyr leg to a lower threshold and its Gu leg higher: the tilted variant swaps documented Gu floods for extra Deyr activations, drops Juba's severe-year coverage from 0.50 to 0.38, and pushes the overall frequency to 1-in-2.9, under the ≥ 3-year specification. The calibration already leans Deyr where the data support it (both Deyr legs run at lower pair-RP thresholds than the Gu legs); forcing more requires accepting misses the gauge record says are real.
The honest reading: at basin level the impact data endorse the adopted near-equal split; at season level a deliberate Deyr tilt is a working-group lever, quantified and ready, but it trades verified gauge-flood coverage for impact-weighted frequency, a values decision, not a statistical one.
Open items before a trigger report
- GloFAS v5 reforecast: re-verify both Deyr legs and the readiness band when EWDS publishes one.
- Operational tuning of Juba Deyr and Shabelle Gu: the proxy over-firing (and the 1-in-26 calibration leg it sits under) and the all-4-pairs fragility above; trade N against RP within the basin budgets using operational data.
- Provider-dependency decision: the no-Google variant (switch at the top of this page) shows the mechanism survives Google's loss at 1-in-3.7 overall, but Shabelle Gu collapses to a single station-model and Shabelle severe coverage falls to 4/7. If the working group wants a provider-independence guarantee, that is a design constraint to set now, not after a provider change.
- Gauge network watch: the candidate set is the five SNRFA
gauges still reporting. If SWALIM revives Bardheere (data stop Nov 2023) or
Bualle (Mar 2024), the Juba pool widens and its severe-year coverage likely
recovers; conversely a further gauge loss shrinks a pool that has no slack.
Season tilt (Deyr-ward) is quantified in
som_ms_impact_tiltif the working group wants it. - GEOGloWS operational debias: before its votes count live, either SFDC-map its forecasts onto the retrospective climatology (the method from the team's Nepal technical note, fitted on the 2024+ overlap) or refit its thresholds on forecast climatology as the archive grows; validate against whichever Deyr/Gu seasons the archive then covers.
- Version pinning for operations: action thresholds here are v5-climatology (GloFAS pairs), the readiness/backtest thresholds v4-climatology; refit on one consistent operational product before go-live.
- Formal impact-record cross-check: the year-by-year table above is descriptive; a formal statistic requires the working group to fix an impact threshold ("what counts as a year that should have triggered").
- Final threshold adjustment to the working group's exact return-period targets, and the funding-split decision.