
Latest forecasts against the trigger thresholds
How to read this chart
Each line is one station, shown as a percentage of its own trigger level. Above the red line, the station counts. The blue band covers the next 7 days and decides activation. The orange band covers days 8 to 12 and decides readiness. A flood that is ten days away appears in the orange band first and moves into the blue band as the days pass. That is why readiness normally comes before activation.
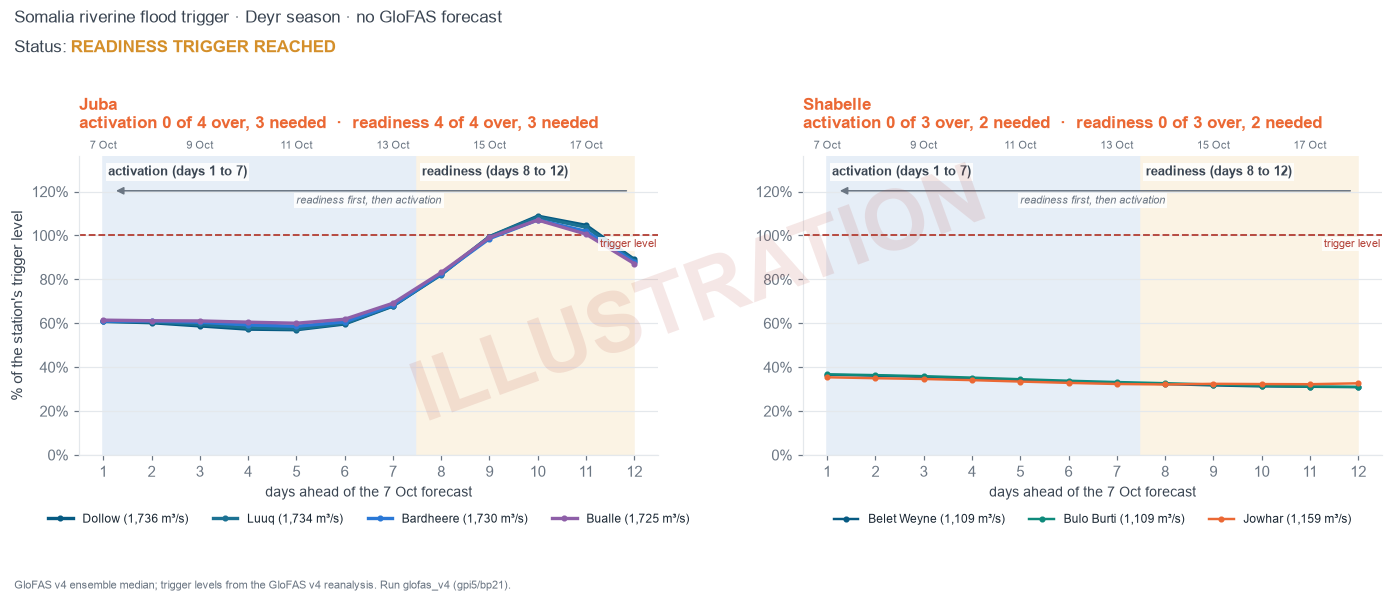
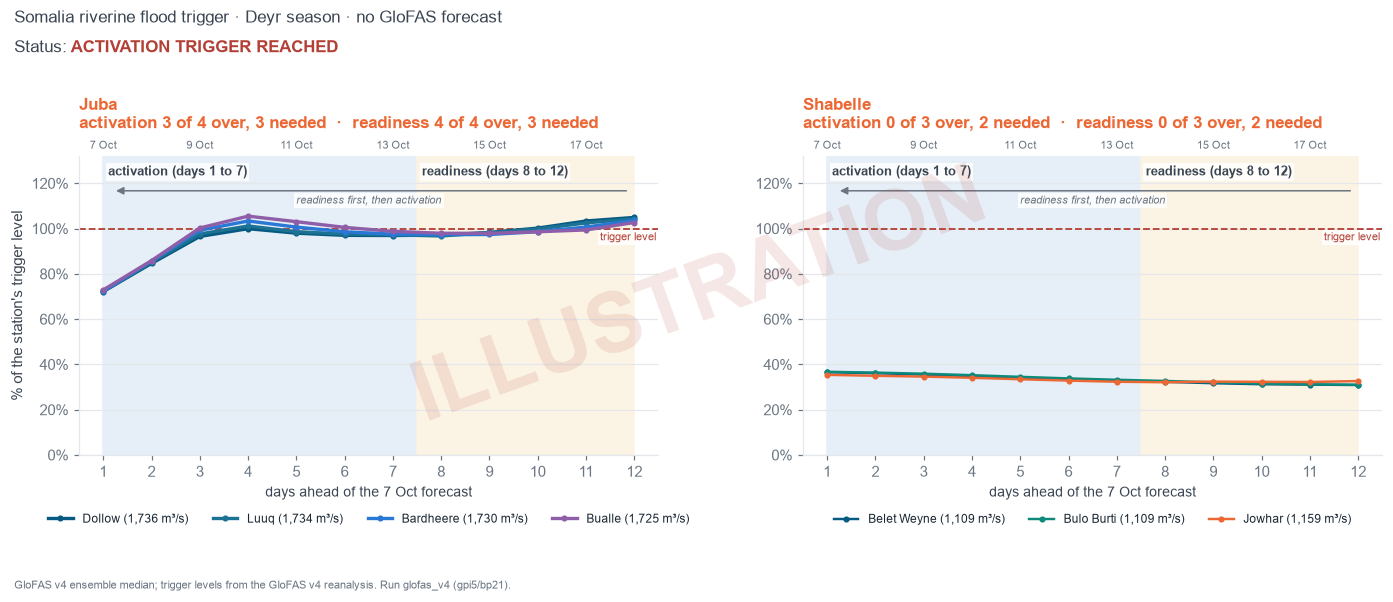
These two charts are illustrations, not readings. They take a real forecast day and scale up the Juba values.
Forecast peak at each station
For each window of the season being monitored, the forecast peak at each station within the leg's lead band and inside the window months, against the station's threshold. A ratio of 1.00× or more means the peak reaches the threshold and the station votes.
How to read this page
- Four windows, one source each. Gu (window February to June) runs on Google Flood Hub, Deyr (window September to January) on GloFAS. A window's trigger is reached when, on a single forecast day, enough of the river's stations are forecast at or above their own return-period threshold: Juba needs 3 of 4 stations, Shabelle 2 of 3. Any one window reaching its trigger releases the allocation.
- Activation reads leads 1 to 7 days on the window's source. Readiness reads GloFAS at leads 8 to 12 days for every window, against discharge return level thresholds fitted on the same reanalysis record as the action leg, and releases only the mobilisation share.
- SWALIM. The framework also allows the readiness trigger to be reached on a SWALIM moderate flood risk alert for either river. Bulletins are not read by this pipeline. Check the SWALIM river levels alongside it.
- A window is open by calendar month: Deyr from September to January, Gu from February to June. Every forecast day inside the window counts, so monitoring for Deyr starts in September and for Gu in February. The thresholds and return periods are fitted on the three season months only (Gu March to May, Deyr October to December); the months either side are a surveillance buffer. In July and August the pipeline still runs and this page still updates, but no email is sent.
- Full design and evidence: the trigger summary and the analysis page. Which GloFAS version is live, and what it does to the thresholds: GloFAS version switch.
Contact
Reach out to OCHA Data Science at ocha-datascience@un.org with any questions.