ENSO country deep dive
Eritrea
Survey catalogue says
El Niño → drier, JJAS kiremti
robust source: Dai & Wigley 2000 (GRL), inherited from the Ethiopia / Sudan highlands row
This review assesses
El Niño → drier inland; wetter on the coast, JJAS inland · OND–DJF coast
moderate Direction well supported by the Ethiopian kiremt literature; Eritrea-specific evidence is thin and the ERA5 amplitude is moderate, with a strong north–south gradient.
Bottom line. The survey catalogue grades Eritrea robust for El Niño → drier JJAS rains. That grade was never earned by Eritrea-specific evidence: it was inherited from the regional row for the Ethiopian, Sudanese and South Sudanese highlands. The direction is right — Eritrea's kiremti rains are the northern tail of Ethiopia's kiremt system — but the Eritrea-specific literature is thin, and ERA5 shows a moderate signal (country JAS r ≈ −0.41) that is strong only along the Tigray border and fades to near nothing in the northern highlands around Anseba. The Red Sea coast responds the opposite way in its winter rains.
For drought. The correlation understates the drought relevance because the response is asymmetric. Of the nine El Niño kiremti seasons since 1981, five landed in the driest third (1991, 2004, 2009, 2015, 2023) and four in the driest fifth; 2023 was the driest season in the whole record. But three El Niño years (1982, 1987, 1997) were near normal or wet, and eight of the fifteen driest seasons were ENSO-neutral. El Niño roughly doubles the odds of a bad kiremti; it explains about a third of them.
Recommendation. Regrade to moderate, cite the Ethiopia/Eritrea-specific studies rather than a global composite, and mark the country bidirectional (JJAS drier inland, OND–DJF wetter on the coast), as Ethiopia and Yemen already are.
Why the catalogue says “robust”
The literature map was built region by region. Eritrea sat inside the Horn of Africa block with Djibouti, Sudan and South Sudan, and the whole block took the grade of one regional finding: “Ethiopia / Sudan / S. Sudan highlands — JJAS kiremt / Blue Nile — El Niño drier — Robust”, sourced to Dai & Wigley (2000). That paper is a global 2.5° empirical-orthogonal-function composite of ENSO-related precipitation; it shows the Sahel-to-Ethiopia summer drying belt but says nothing specific about Eritrea.
Two consequences follow. First, the per-country catalogue row for Eritrea carries a single global citation and a “gap vs NOAA/IRI” badge that both belong to the Ethiopian row. Second, the confidence shading on the map (dark brown = robust) tells a reader that the Eritrean link is as well replicated as Ethiopia's, which the evidence below does not support.
What the literature actually supports
The regional mechanism is solid. Ethiopia's June–September kiremt rains are among the best-documented ENSO teleconnections in Africa. Korecha & Barnston (2007) find a strong negative correlation between kiremt rainfall and tropical Pacific SST and use Niño3.4 as the leading predictor; Gleixner et al. (2017) show the mechanism (warm Pacific SST → weaker Tropical Easterly Jet and East African low-level jet → subsidence over the highlands); Segele & Lamb (2005) and Diro et al. (2011) replicate the sign across station networks. The Eritrean highlands and western lowlands receive their kiremti rains from the same monsoon flow, so a drying tendency under El Niño is physically expected.
Eritrea-specific evidence is thin. The one study that treats Eritrea directly is Seleshi & Demarée (1995), which relates rainfall indices for the north-central Ethiopian and Eritrean highlands over 1900–1990 to the Southern Oscillation Index and finds main-season droughts more likely in warm-ENSO years. A later Eritrean-highlands study finds Indian Ocean SST, not the Pacific, to be the strongest predictor of July–August rainfall at Asmara and Mendefera. Nicholson's (2017) review of eastern African rainfall characterises the ENSO link to the summer rains of northern Ethiopia and Eritrea as much weaker than in the rest of the region.
The coast is a different climate. The Red Sea coastal plain and the eastern escarpment get their rain in winter (roughly October–February), from onshore flow over the Red Sea rather than the summer monsoon. The Horn's winter and short-rains season is wetter under El Niño, and ERA5 reproduces that here with correlations above +0.5, a signal the country-level survey cannot show because those months are a small share of the national total.
Operational record. The 2015 El Niño produced a widely reported Eritrean drought: FAO GIEWS recorded kiremti rainfall below the long-term average in most of Maekel, Gash Barka, Anseba and eastern Debub, and a UN rapid assessment in Anseba and Northern Red Sea found that about 90% of the areas that normally flood for spate irrigation did not. The 2023 El Niño coincided with the driest ERA5 kiremti in the 45-year record.
Taken together: direction robust by regional analogy, amplitude and Eritrea-specific replication moderate. That is the definition of the catalogue's moderate grade.
What ERA5 shows
Latest Niño3.4 in NOAA PSL's current series: +1.89 °C for August 2026 (three-month mean +1.73), i.e. El Niño conditions by the ±0.5 threshold used on this page. The historical analysis below uses the survey's pinned Niño3.4 series (NOAA PSL, ERSST v5 basis), which runs about 0.2 °C cooler than the current ERSST v6 series.
Everything in this section is computed from the same ERA5 monthly grid and NOAA Niño3.4 index the survey uses, restricted to the cells inside the country. A cell–season is analysed only if that season holds at least a quarter of the cell's annual rainfall and averages at least 0.25 mm/day (the survey's rainy-season and aridity filters).
Seasonal cycle
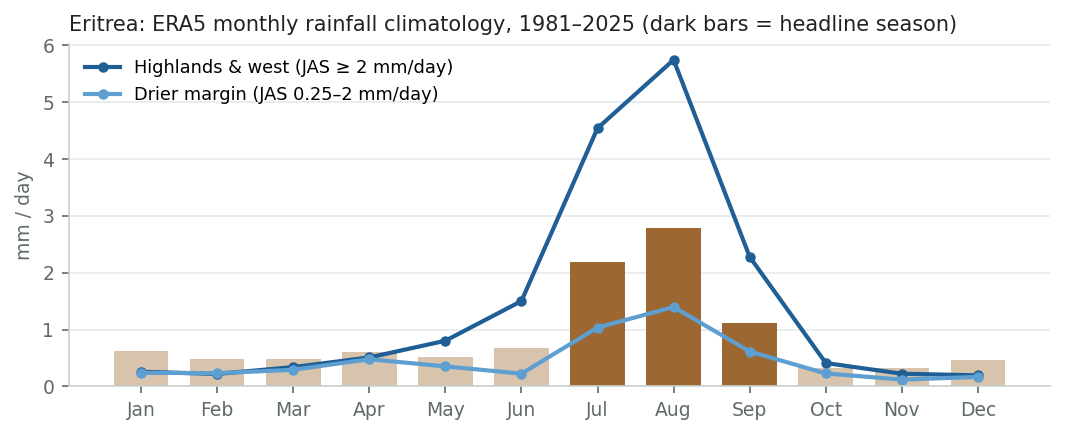
Eritrea is a summer-rain country in the aggregate: July–September carries about 58% of the annual total over the average cell, and the June–September kiremti nearly all of it. The winter rains that matter on the coast (October–February) are only 10–16% of the national mean, which is why the survey's 25% rainy-season filter drops them at country level.
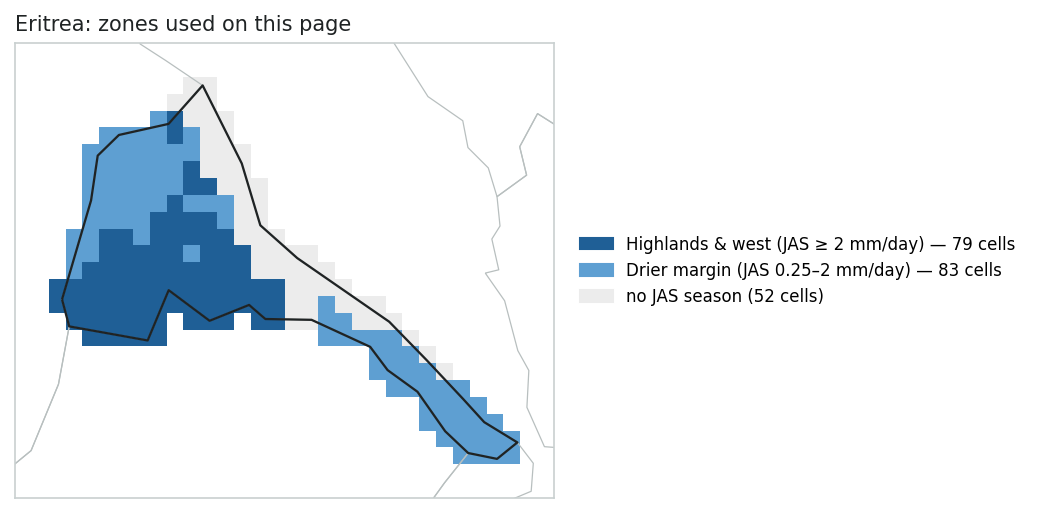
Pixel-level correlation with Niño3.4
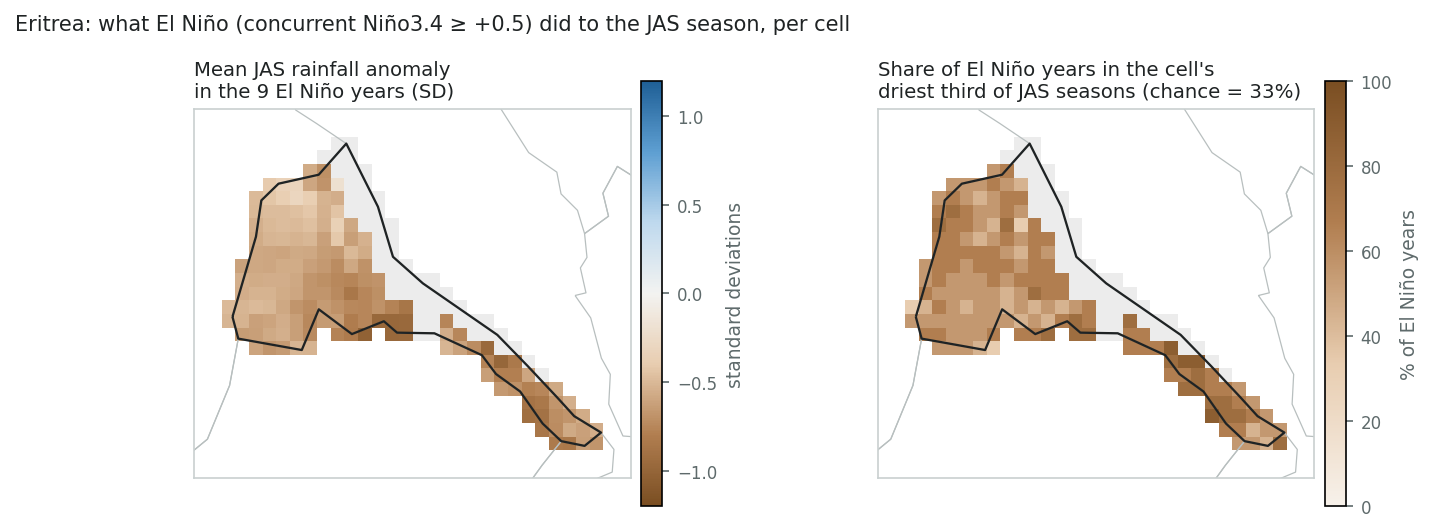
At pixel level the summer signal is real but moderate and strongly graded from south to north. Along the Tigray border and in the south-east the correlation reaches −0.5 or below; across the central highlands it sits around −0.3; in the northern highlands around Anseba and the north-west it weakens to −0.15 to −0.25, below the survey's colour threshold. Only about one cell in eight clears the survey's “strong” bin. In the winter windows the coastal cells respond the opposite way, with OND correlations above +0.5 in every analysable cell.
This is why the survey's pixel map looks mixed: in the default view (pixel, unique signal, 3-month lag) Eritrea shows a patchwork of moderate brown inland, blue on the coast, and blanks where no season passes the filters.
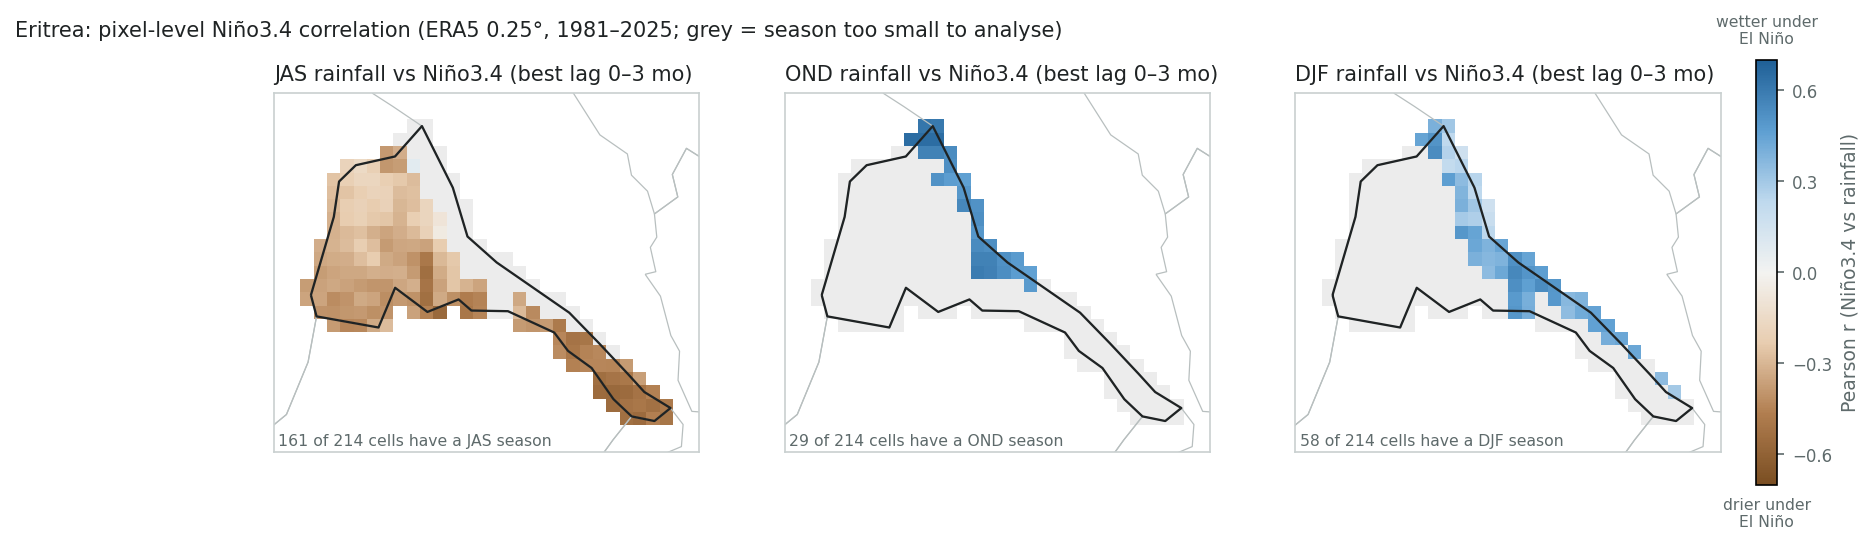
| Season | Cells analysed | Share of annual rain | Median r | Range | Significant (p<0.05) | |r| ≥ 0.30 | |r| ≥ 0.50 |
|---|---|---|---|---|---|---|---|
| JAS | 162 / 214 | 58% | −0.35 | −0.57 to +0.07 | 70% negative | 69% | 12% |
| OND | 29 / 214 | 11% | +0.53 | +0.46 to +0.65 | 100% positive | 100% | 72% |
| DJF | 58 / 214 | 16% | +0.41 | +0.17 to +0.55 | 81% positive | 81% | 12% |
Country-level view (the survey's ADM0 pass)
Averaged to a national series the JAS signal is −0.41 (best at a one-month lead, i.e. June–August Niño3.4 against July–September rain), against −0.63 for Ethiopia and −0.59 for South Sudan. The concurrent JJA correlation misses significance and the partial correlation (other modes held constant) drops to −0.27. The strongest correlations in the table are the winter ones, and they are positive.
| Trimester | Share of annual rain | Total r (best lag) | Lag (mo) | p | Unique-signal r (partial) |
|---|---|---|---|---|---|
| NDJ filtered * | 14% | +0.55 | 0 | 0.000 | +0.40 |
| DJF filtered * | 16% | +0.49 | 0 | 0.001 | +0.44 |
| JFM filtered * | 15% | +0.29 | 1 | 0.058 | +0.15 |
| FMA filtered * | 15% | +0.24 | 2 | 0.119 | +0.05 |
| MAM filtered * | 15% | +0.18 | 0 | 0.243 | +0.22 |
| AMJ filtered * | 16% | +0.15 | 3 | 0.333 | +0.19 |
| MJJ | 30% | +0.19 | 3 | 0.215 | +0.35 |
| JJA | 52% | −0.29 | 0 | 0.056 | −0.09 |
| JAS | 58% | −0.41 | 1 | 0.005 | −0.27 |
| ASO | 41% | −0.31 | 2 | 0.042 | −0.29 |
| SON filtered * | 18% | +0.17 | 0 | 0.263 | −0.01 |
| OND filtered * | 11% | +0.58 | 0 | 0.000 | +0.18 |
* Below the survey's rainy-season filter (trimester climatology under 25% of the annual mean), so the survey never shows these correlations at country level; they are listed here because the coastal winter signal is part of the story.
El Niño and JAS drought
Drought is where the signal earns its keep. A Pearson r describes a symmetric linear relationship; the kiremti response to ENSO is not symmetric. La Niña years are reliably wet (only two of twelve in the driest third), while El Niño years split: five of nine were in the driest third and four in the driest fifth, but 1982, 1987 and 1997 were near normal or wet — 1997, the strongest event of the period, did not produce a highland drought. Neutral years supply most droughts in absolute terms, including the severe 1990, 2017 and 2021 seasons.
Read as odds: an El Niño roughly doubles the chance of a driest-third kiremti (about 55% against a 33% base rate) and quadruples the chance of a driest-fifth one, but an El Niño forecast alone would have missed two thirds of the bad seasons. It is a useful readiness signal, not a trigger.
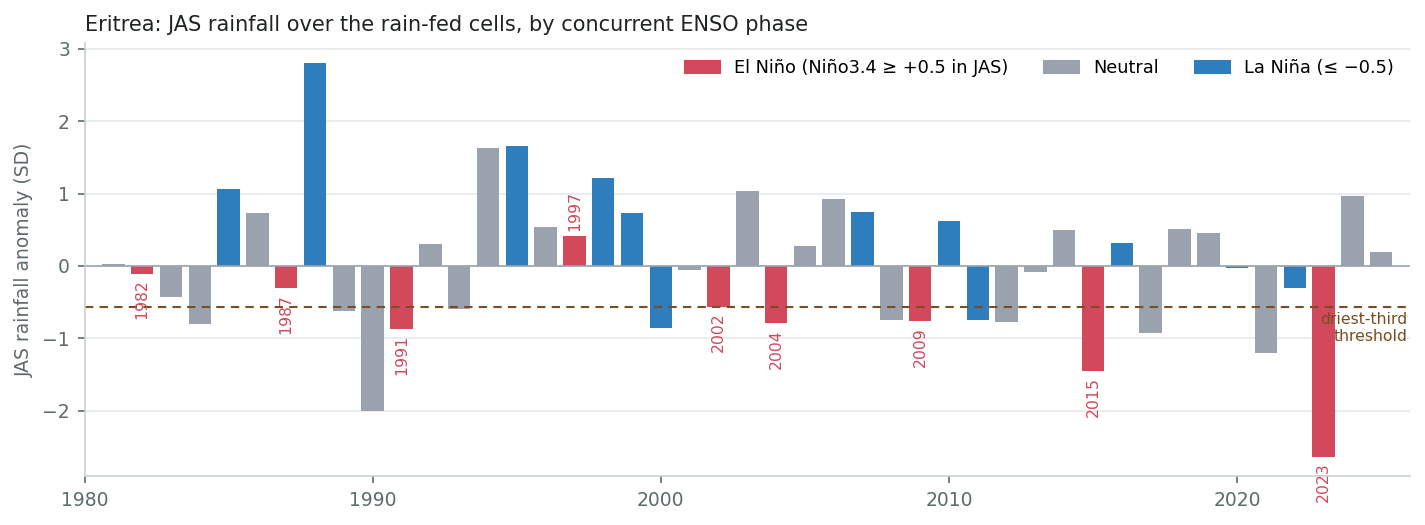
| ENSO phase (concurrent) | Seasons | Mean anomaly (SD) | In driest third | In driest fifth | In wettest third |
|---|---|---|---|---|---|
| El Niño | 9 | −0.79 | 56% | 44% | 0% |
| Neutral | 24 | −0.01 | 33% | 17% | 33% |
| La Niña | 12 | +0.60 | 17% | 8% | 58% |
Every El Niño JAS season since 1981
| Year | Niño3.4 (JAS) | Rainfall anomaly (SD) | Rank (1 = driest) | Outcome |
|---|---|---|---|---|
| 1982 | +0.86 | −0.11 | 20 of 45 | near normal |
| 1987 | +1.50 | −0.31 | 19 of 45 | near normal |
| 1991 | +0.62 | −0.87 | 6 of 45 | driest fifth |
| 1997 | +1.86 | +0.40 | 29 of 45 | near normal |
| 2002 | +0.90 | −0.56 | 16 of 45 | near normal |
| 2004 | +0.69 | −0.79 | 9 of 45 | driest fifth |
| 2009 | +0.57 | −0.76 | 11 of 45 | driest third |
| 2015 | +1.87 | −1.45 | 3 of 45 | driest fifth |
| 2023 | +1.32 | −2.63 | 1 of 45 | driest fifth |
The 15 driest-third JAS seasons: 1984 (Neutral), 1989 (Neutral), 1990 (Neutral), 1991 (El Niño), 1993 (Neutral), 2000 (La Niña), 2004 (El Niño), 2008 (Neutral), 2009 (El Niño), 2011 (La Niña), 2012 (Neutral), 2015 (El Niño), 2017 (Neutral), 2021 (Neutral), 2023 (El Niño). Phase split: Neutral 8, El Niño 5, La Niña 2.
By zone
| Zone | Cells | Zone-mean r (concurrent) | El Niño composite (median SD) | El Niño years in the zone's driest third | Per-cell median |
|---|---|---|---|---|---|
| Highlands & west (JAS ≥ 2 mm/day) | 79 | −0.41 | −0.65 | 67% | 56% |
| Drier margin (JAS 0.25–2 mm/day) | 83 | −0.40 | −0.57 | 67% | 67% |
By province: the same numbers from the team's ERA5 raster stats
The zones above are analysis bands; operational units are provinces. This section repeats the headline-season analysis on the team's standard per-admin ERA5 raster stats (monthly means per admin-1 unit from public.era5, the same table the SEAS5 skill app and the drought triggers use), so nothing here is recomputed from pixels: each province's season series is the stored mean, correlated with concurrent Niño3.4 and ranked against its own history.
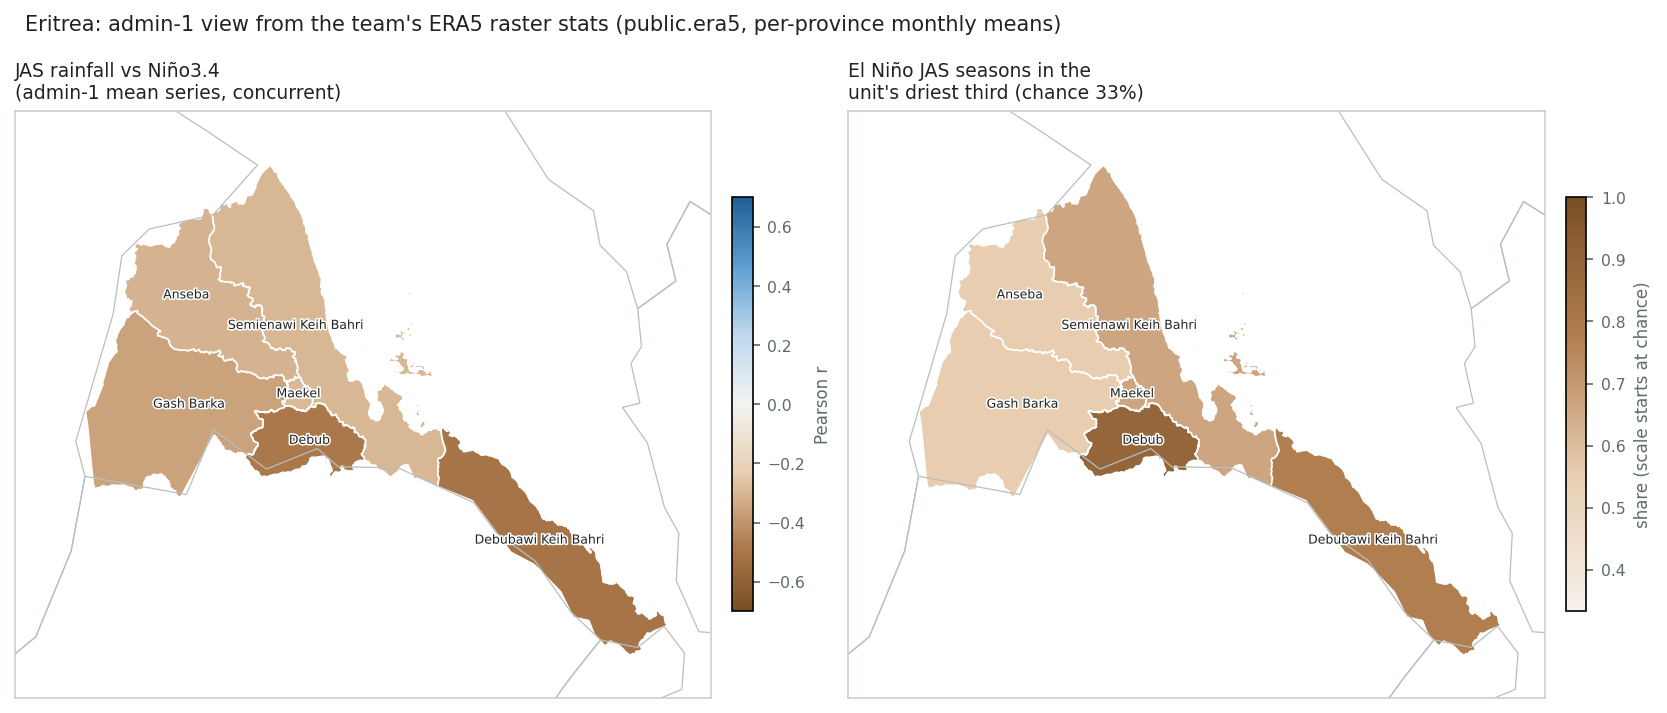
| Province | ERA5 pixels | r (concurrent) | El Niño mean (SD) | El Niño seasons in driest third | La Niña in driest third | El Niño driest-third seasons |
|---|---|---|---|---|---|---|
| Debubawi Keih Bahri | 722 | −0.51 | −0.82 | 78% of 9 | 8% | 1987, 1991, 1997, 2004, 2009, 2015, 2023 |
| Debub | 317 | −0.50 | −0.98 | 89% of 9 | 8% | 1982, 1987, 1991, 1997, 2002, 2004, 2015, 2023 |
| Gash Barka | 1129 | −0.36 | −0.67 | 56% of 9 | 25% | 1991, 2004, 2009, 2015, 2023 |
| Anseba | 711 | −0.31 | −0.61 | 56% of 9 | 17% | 1991, 2004, 2009, 2015, 2023 |
| Semienawi Keih Bahri | 1177 | −0.30 | −0.81 | 67% of 9 | 17% | 1991, 2002, 2004, 2009, 2015, 2023 |
| Maekel | 36 | −0.29 | −0.73 | 67% of 9 | 17% | 1982, 1991, 2002, 2004, 2015, 2023 |
Can SEAS5 forecast it? Skill of the Jun issuance, by zone
A teleconnection is only useful for anticipatory action if the seasonal forecast can carry it. The figure reads the seas5-skill app's per-pixel skill cube — the temporal Pearson r between the detrended ECMWF SEAS5 trimester forecast and detrended ERA5, per 0.4° pixel — for forecasts issued on 1 Jun, sampled at this page's cells and summarised as the median pixel r per zone. Bins are the app's (low < 0.30 ≤ moderate < 0.50 ≤ high). Each point is one three-month window the issuance covers, drawn on its middle month under the rainy-season climatology, so the reader sees which part of the season each forecast window reaches and how much skill it has there.
What the Jun 2026 issuance forecasts. Windows at or beyond the app's 3-year return-period threshold, by zone (in-season windows excluded): Highlands & west: JJA dry 46 yr (low skill), JAS dry 46 yr (moderate skill), ASO dry 46 yr (low skill), SON dry 3 yr (low skill), OND wet 46 yr (low skill); Drier margin: JJA dry 46 yr (moderate skill), JAS dry 46 yr (low skill), ASO dry 46 yr (low skill), OND wet 46 yr (low skill); Whole country: JJA dry 46 yr (low skill), JAS dry 46 yr (moderate skill), ASO dry 46 yr (low skill), OND wet 46 yr (low skill). Under the app's rule — an alert needs the return period and at least moderate skill — this issuance would raise an alert for Highlands & west JAS, Drier margin JJA, JAS. A return period at the ceiling (about 46 years) means the forecast is the most extreme of the 45-year hindcast for that window, not a calibrated 1-in-46 probability; read it as “beyond the record”.
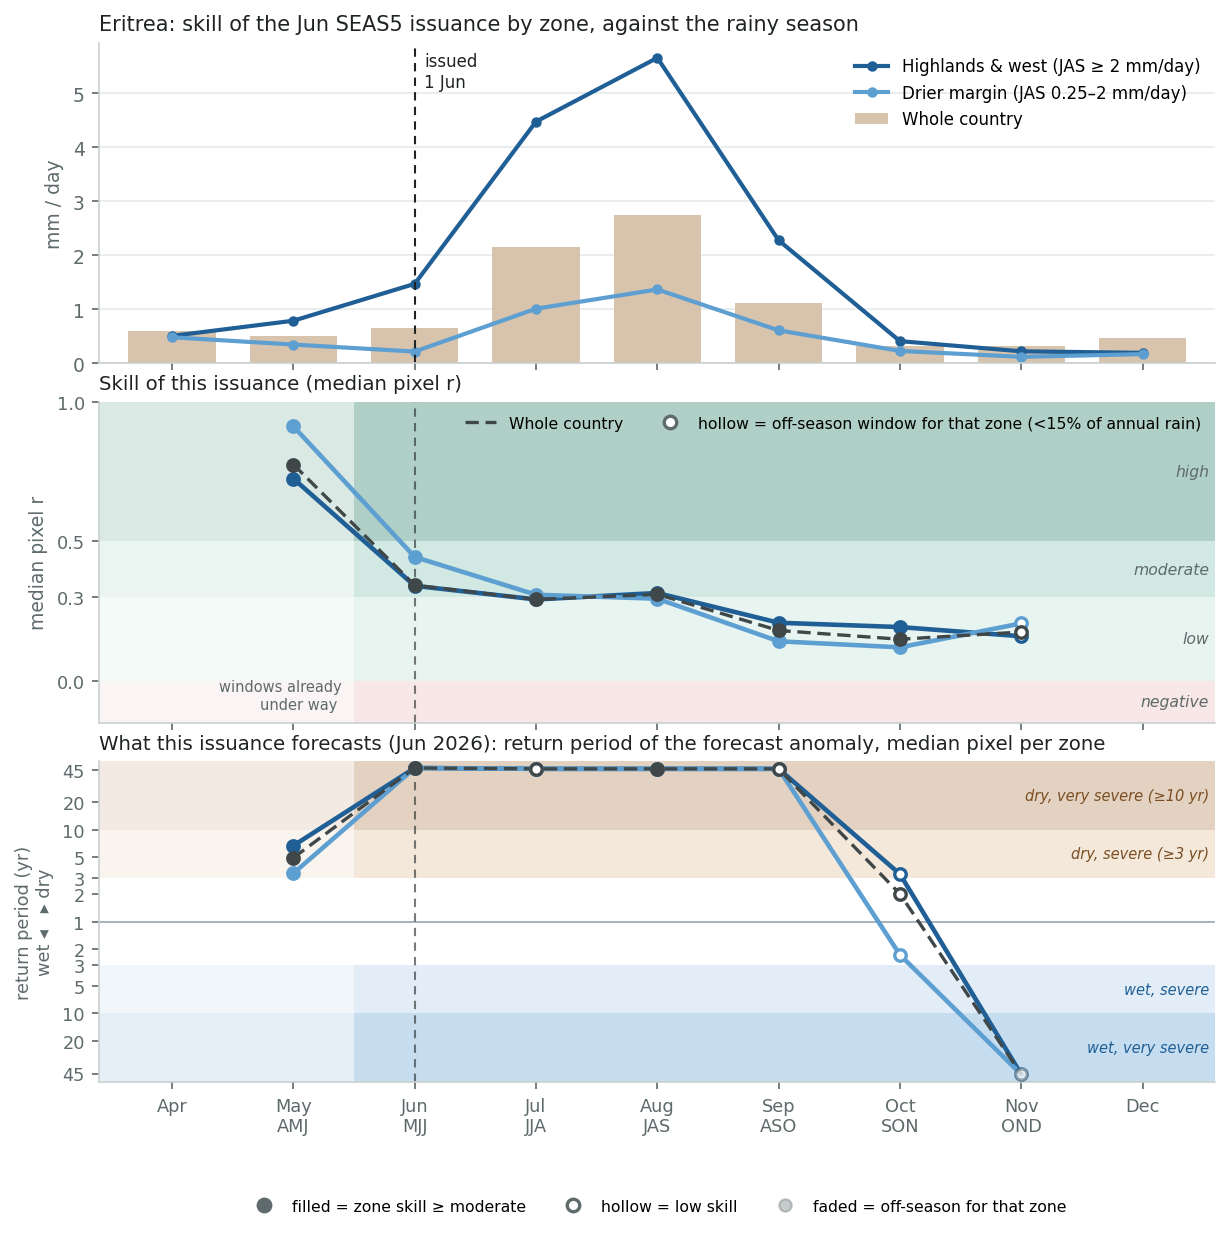
| Zone | Cells | AMJ in-season | MJJ in-season | JJA 0-mo lead | JAS 1-mo lead | ASO 2-mo lead | SON 3-mo lead | OND 4-mo lead |
|---|---|---|---|---|---|---|---|---|
| Highlands & west (JAS ≥ 2 mm/day) | 79 | +0.72 high 100% ≥ mod. · dry 6.7 yr | +0.34 moderate 62% ≥ mod. · dry 47.0 yr | +0.29 low 35% ≥ mod. · dry 46.0 yr | +0.31 moderate 66% ≥ mod. · dry 46.0 yr | +0.21 low 8% ≥ mod. · dry 46.0 yr | +0.19 low 16% ≥ mod. · dry 3.3 yr | +0.16 low 38% ≥ mod. · wet 46.0 yr |
| Drier margin (JAS 0.25–2 mm/day) | 83 | +0.91 high 100% ≥ mod. · dry 3.4 yr | +0.44 moderate 55% ≥ mod. · dry 47.0 yr | +0.31 moderate 51% ≥ mod. · dry 46.0 yr | +0.29 low 48% ≥ mod. · dry 46.0 yr | +0.14 low 25% ≥ mod. · dry 46.0 yr | +0.12 low 5% ≥ mod. · wet 2.3 yr | +0.21 low 27% ≥ mod. · wet 46.0 yr |
| Whole country | 162 | +0.78 high 100% ≥ mod. · dry 5.0 yr | +0.34 moderate 59% ≥ mod. · dry 47.0 yr | +0.29 low 43% ≥ mod. · dry 46.0 yr | +0.31 moderate 57% ≥ mod. · dry 46.0 yr | +0.18 low 17% ≥ mod. · dry 46.0 yr | +0.15 low 10% ≥ mod. · dry 2.0 yr | +0.17 low 32% ≥ mod. · wet 46.0 yr |
Each cell: median pixel r, its bin, the share of the zone's cells at moderate-or-better skill, and the median return period of the Jun 2026 forecast anomaly (dry = forecast below its hindcast median). Skill source: skill_stats_grid_detrended.nc (seas5-skill, DEV blob), the same cube behind the app's pixel skill map. Median of pixel correlations, not the correlation of the area mean, so it is a conservative summary for a coherent area.
Recommendation for the survey
- Regrade Eritrea's El Niño evidence from robust to moderate in
_LIT_EVIDENCE, and replace the Dai & Wigley citation on its catalogue row with Seleshi & Demarée (1995) and Korecha & Barnston (2007). - Mark bidirectional (JJAS drier inland, OND–DJF wetter on the coast), as Ethiopia and Yemen already are, so the map stops implying a single national response.
- Keep the “gap vs NOAA/IRI” badge on the Ethiopian row only; it was never an Eritrea finding.
- Add the drought framing to the “This study (ERA5)” column: El Niño doubles the odds of a driest-third kiremti (2015, 2023 most recently).
Caveats
- ERA5 is a reanalysis; Eritrea is gauge-sparse, so the rainfall field leans on the model background. The spatial gradient is plausible (it follows the monsoon's northern limit) but should be checked against CHIRPS before it drives a decision.
- Nine El Niño seasons is a small sample; the hit-rate above has wide uncertainty and one more event could move it by ten points.
- The country boundary is Natural Earth 110m rasterised with “all touched”, so edge cells straddle Ethiopia and Sudan.
- No field-significance correction is applied at pixel level; read coherent regions, not single cells.
References
- Korecha, D. & Barnston, A. G. (2007). Predictability of June–September rainfall in Ethiopia. Monthly Weather Review 135, 628–650. link
- Gleixner, S., Keenlyside, N., Viste, E. & Korecha, D. (2017). The El Niño effect on Ethiopian summer rainfall. Climate Dynamics 49, 1865–1883. link
- Segele, Z. T. & Lamb, P. J. (2005). Characterization and variability of Kiremt rainy season over Ethiopia. Meteorology and Atmospheric Physics 89, 153–180.
- Diro, G. T., Grimes, D. I. F. & Black, E. (2011). Teleconnections between Ethiopian summer rainfall and sea surface temperature. Climate Dynamics 37, 103–119.
- Seleshi, Y. & Demarée, G. R. (1995). Rainfall variability in the Ethiopian and Eritrean highlands and its links with the Southern Oscillation Index. Journal of Biogeography 22, 945–952.
- Indian Ocean sea surface temperature and Eritrean highlands rainfall. Physics and Chemistry of the Earth (2004). link
- Nicholson, S. E. (2017). Climate and climatic variability of rainfall over eastern Africa. Reviews of Geophysics 55, 590–635. link
- Dai, A. & Wigley, T. M. L. (2000). Global patterns of ENSO-induced precipitation. Geophysical Research Letters 27, 1283–1286. link
- FAO GIEWS Country Brief: Eritrea, 14 September 2015. link; UN rapid assessment of drought-affected areas of Anseba and Northern Red Sea zones. link
Generated by enso_deep_dive.py from deep_dives/eri.toml. Method and data as in the global survey.