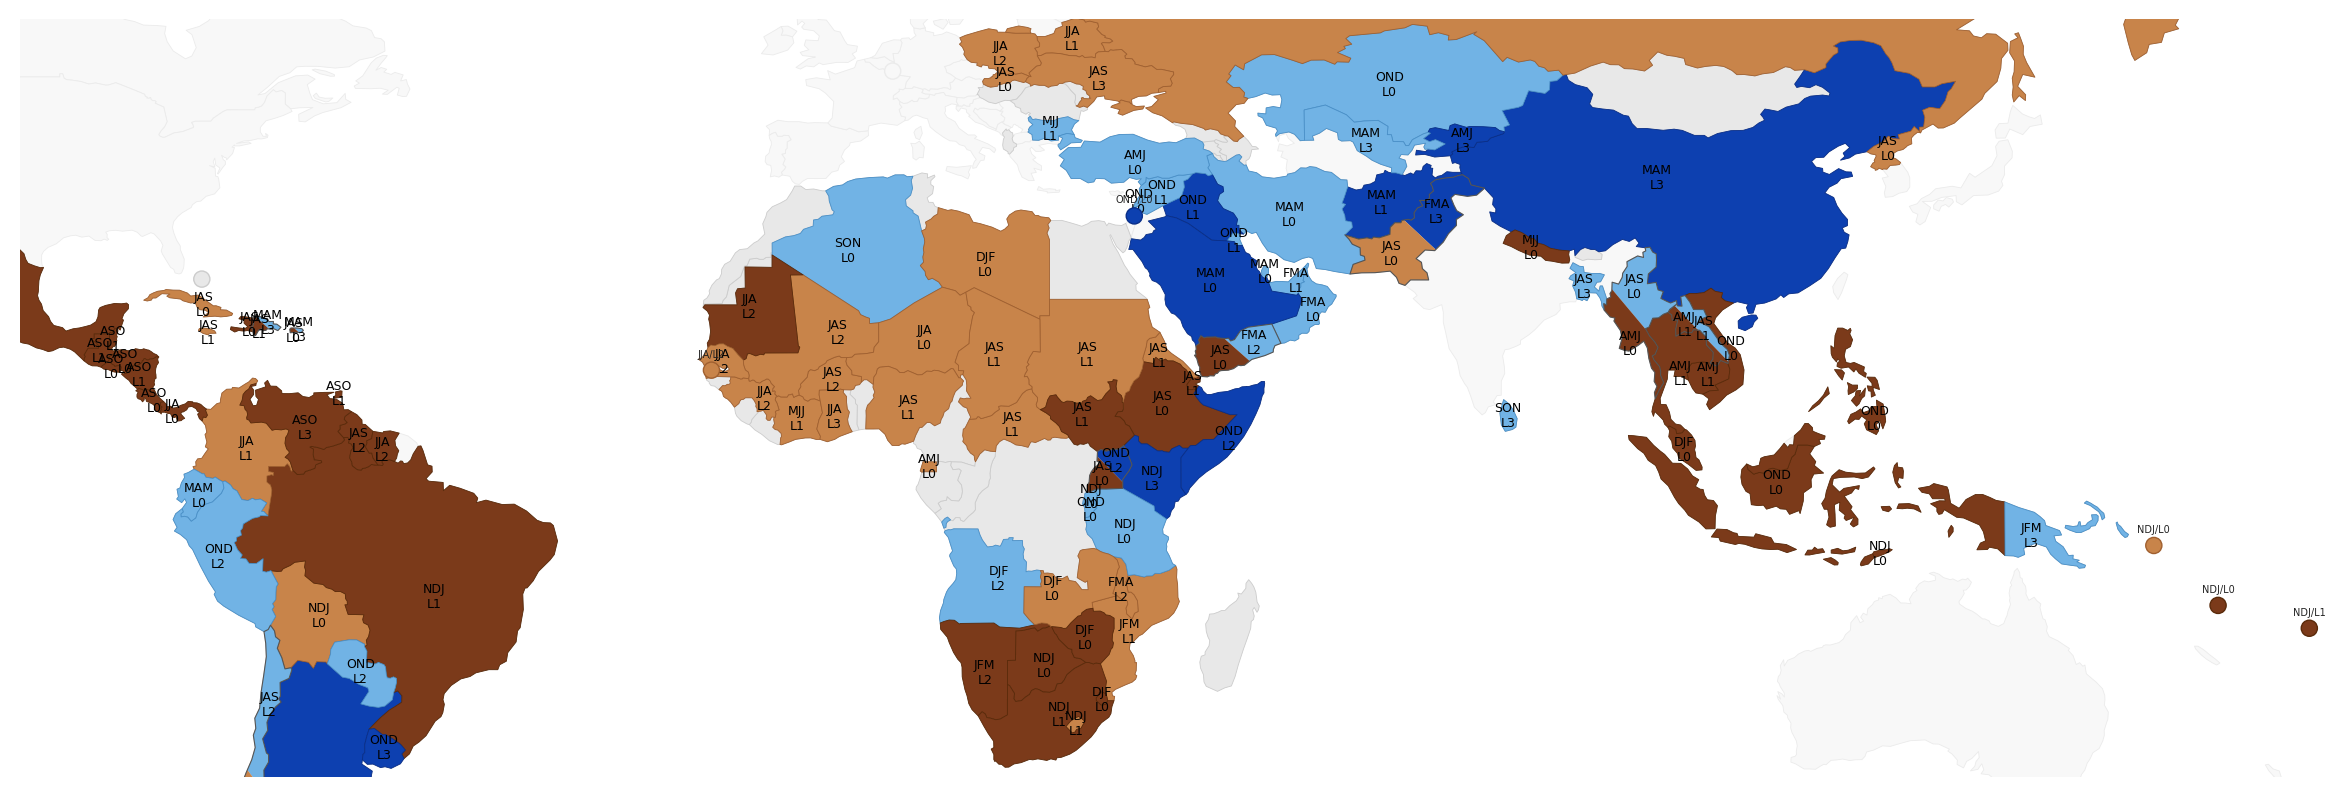
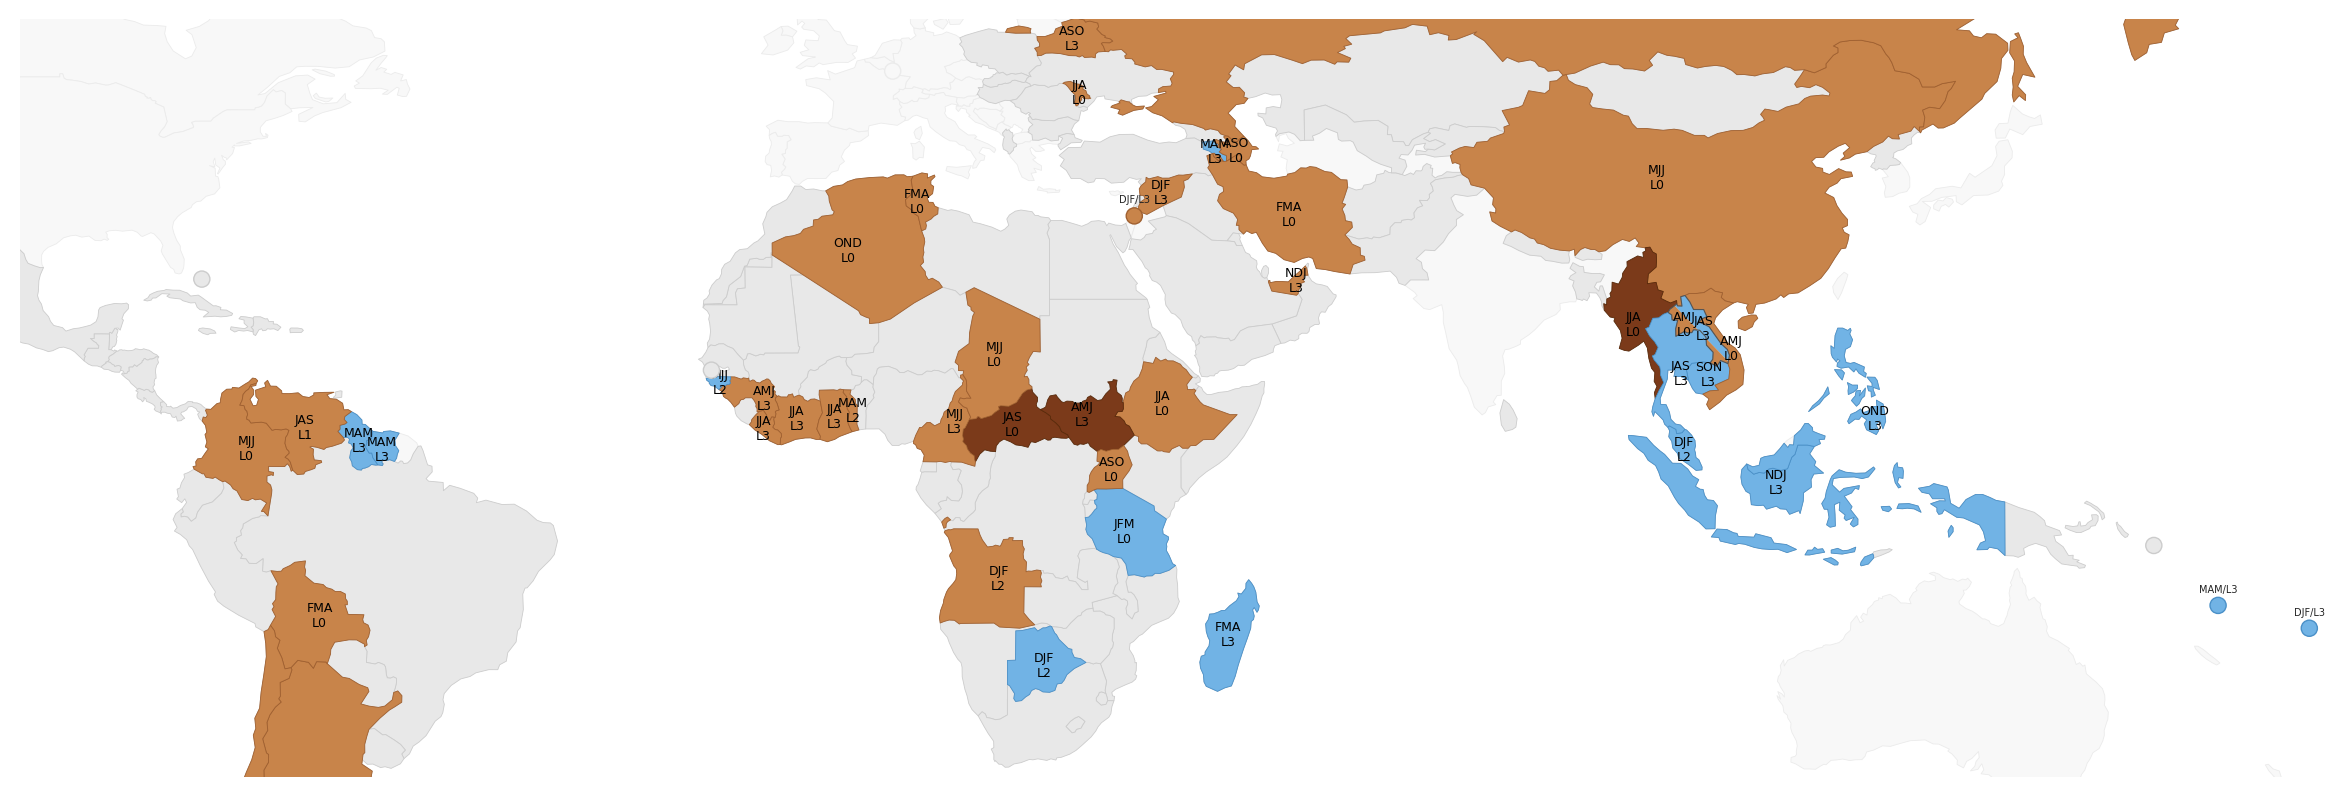
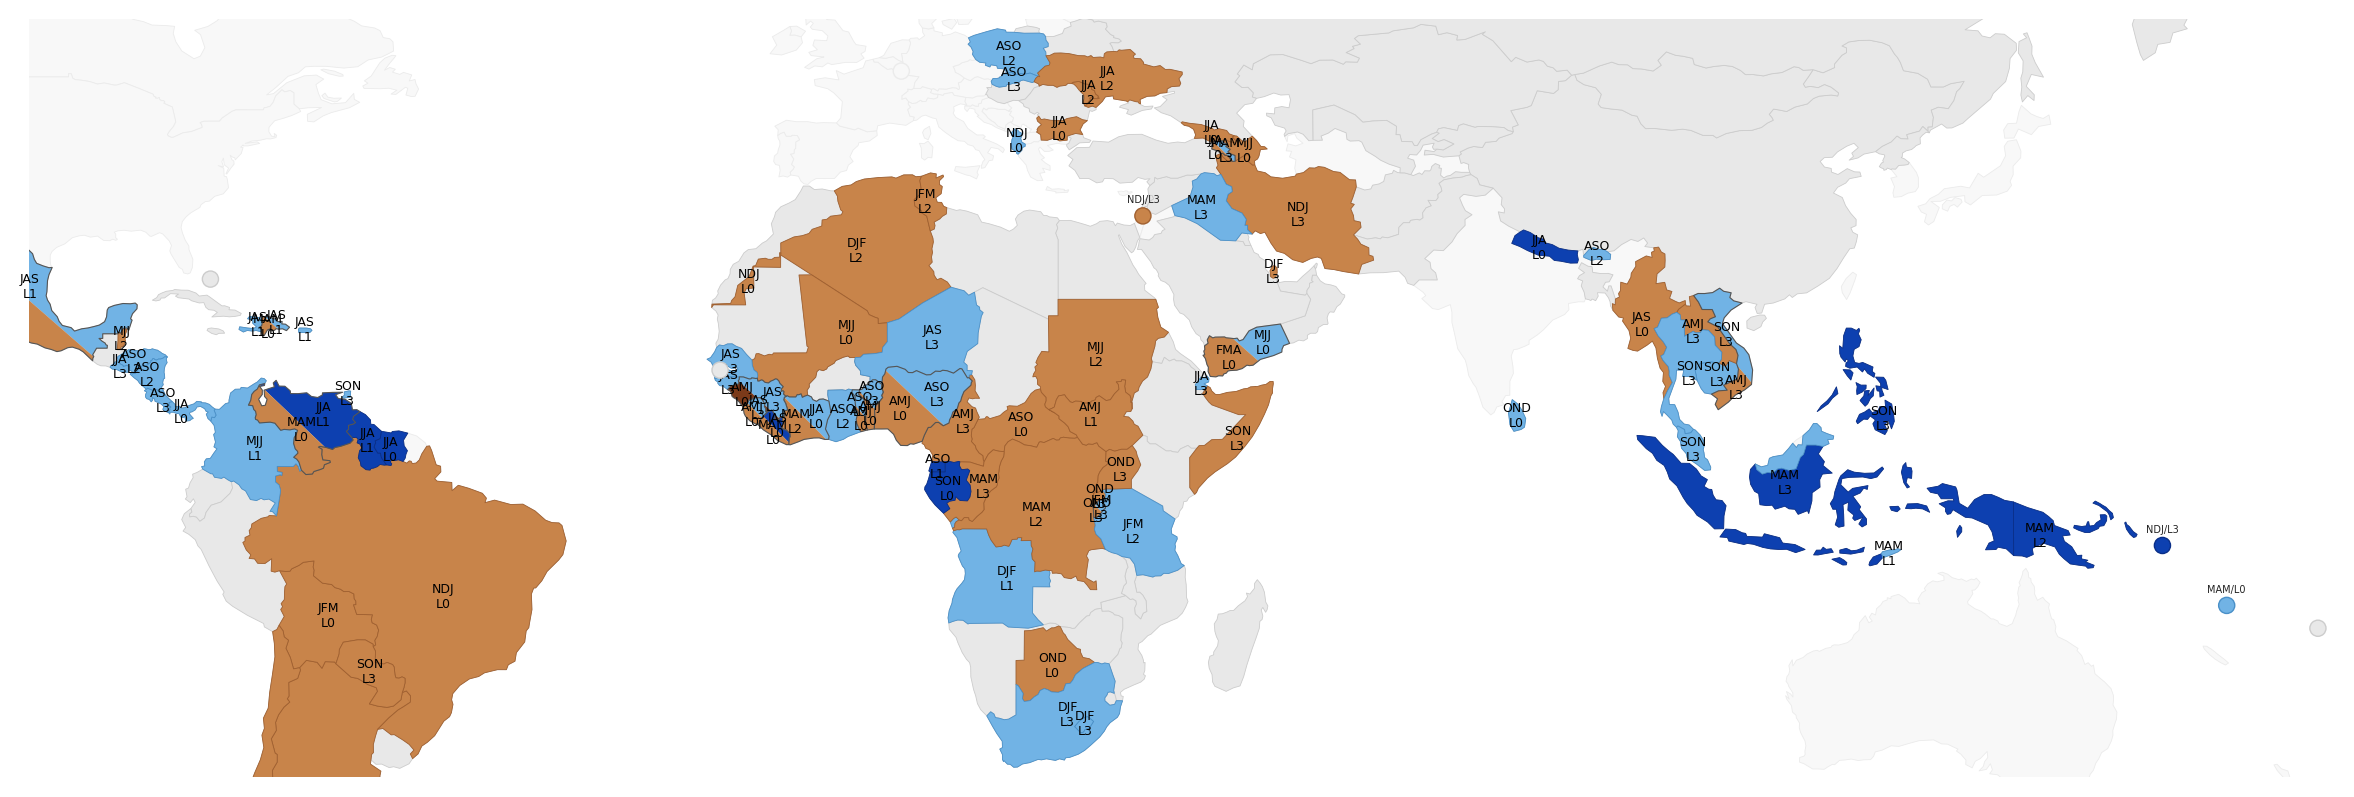
Correlation of Niño3.4 (ENSO) with total seasonal rainfall — total association (0–3 mo lag, country mean)

Total association — pairwise Pearson r, p<0.05. Split diagonal = significant in both directions across non-overlapping seasons.
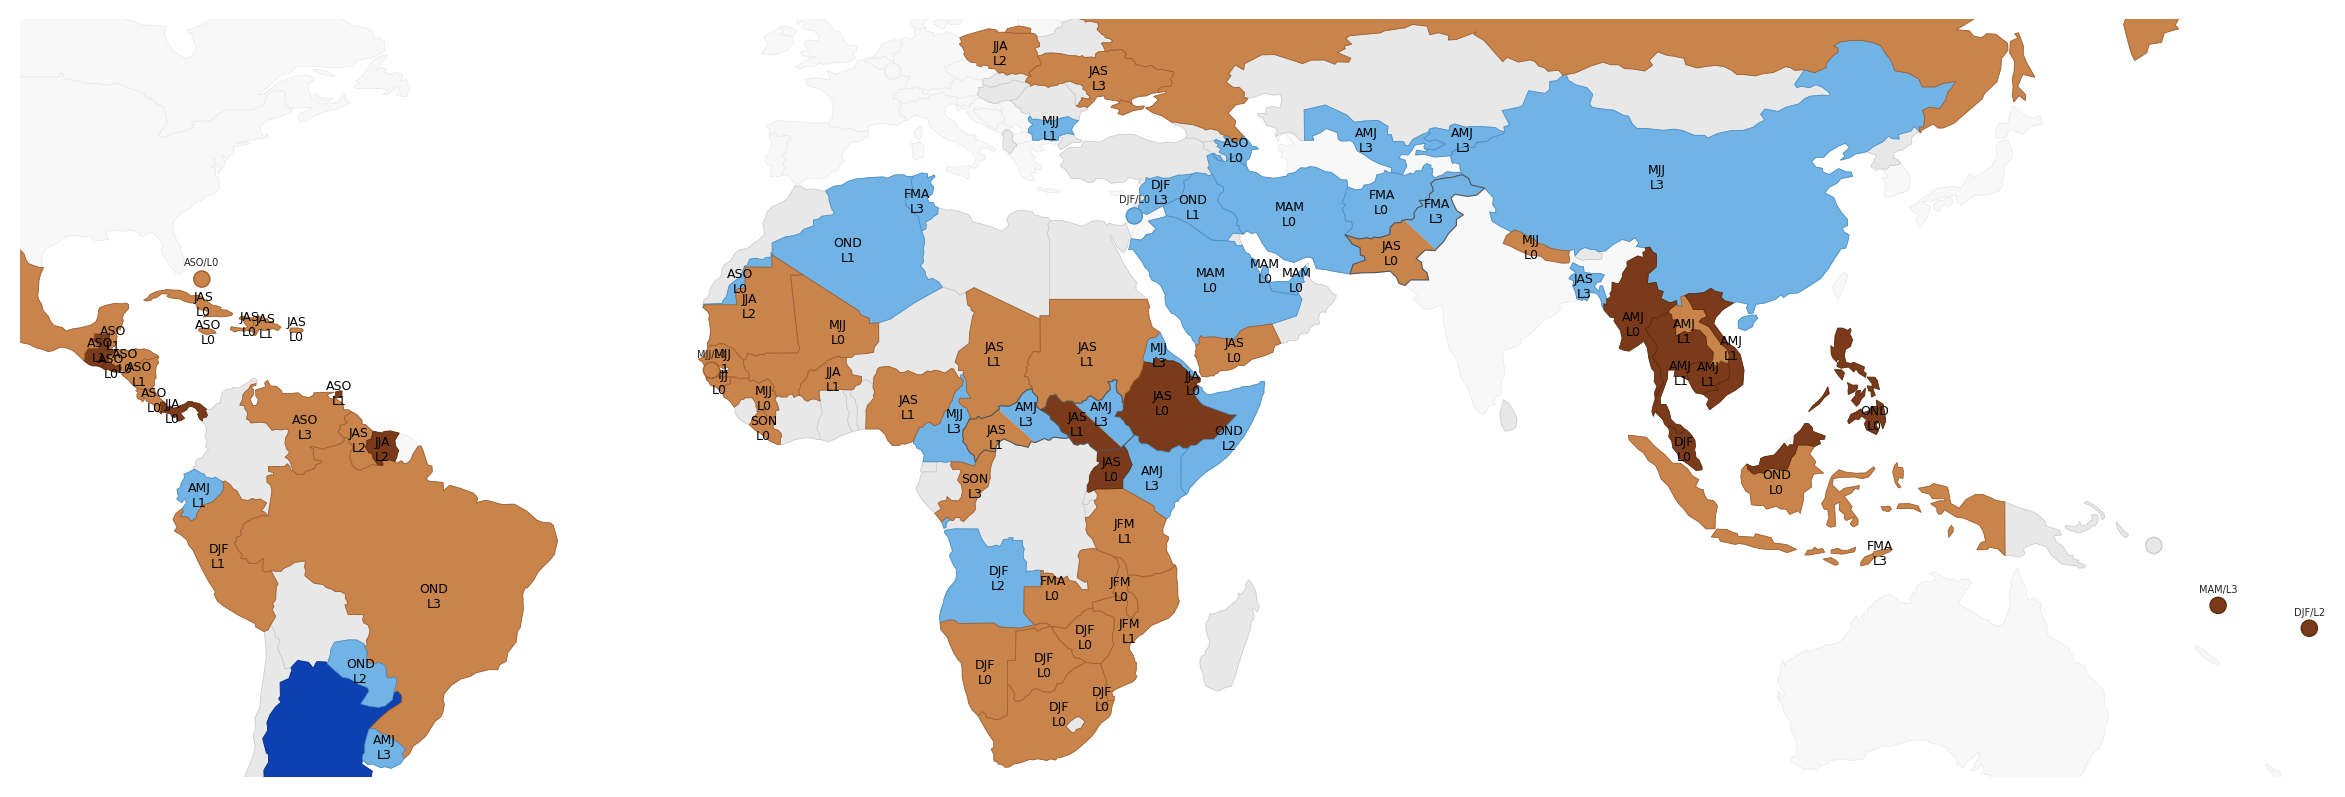
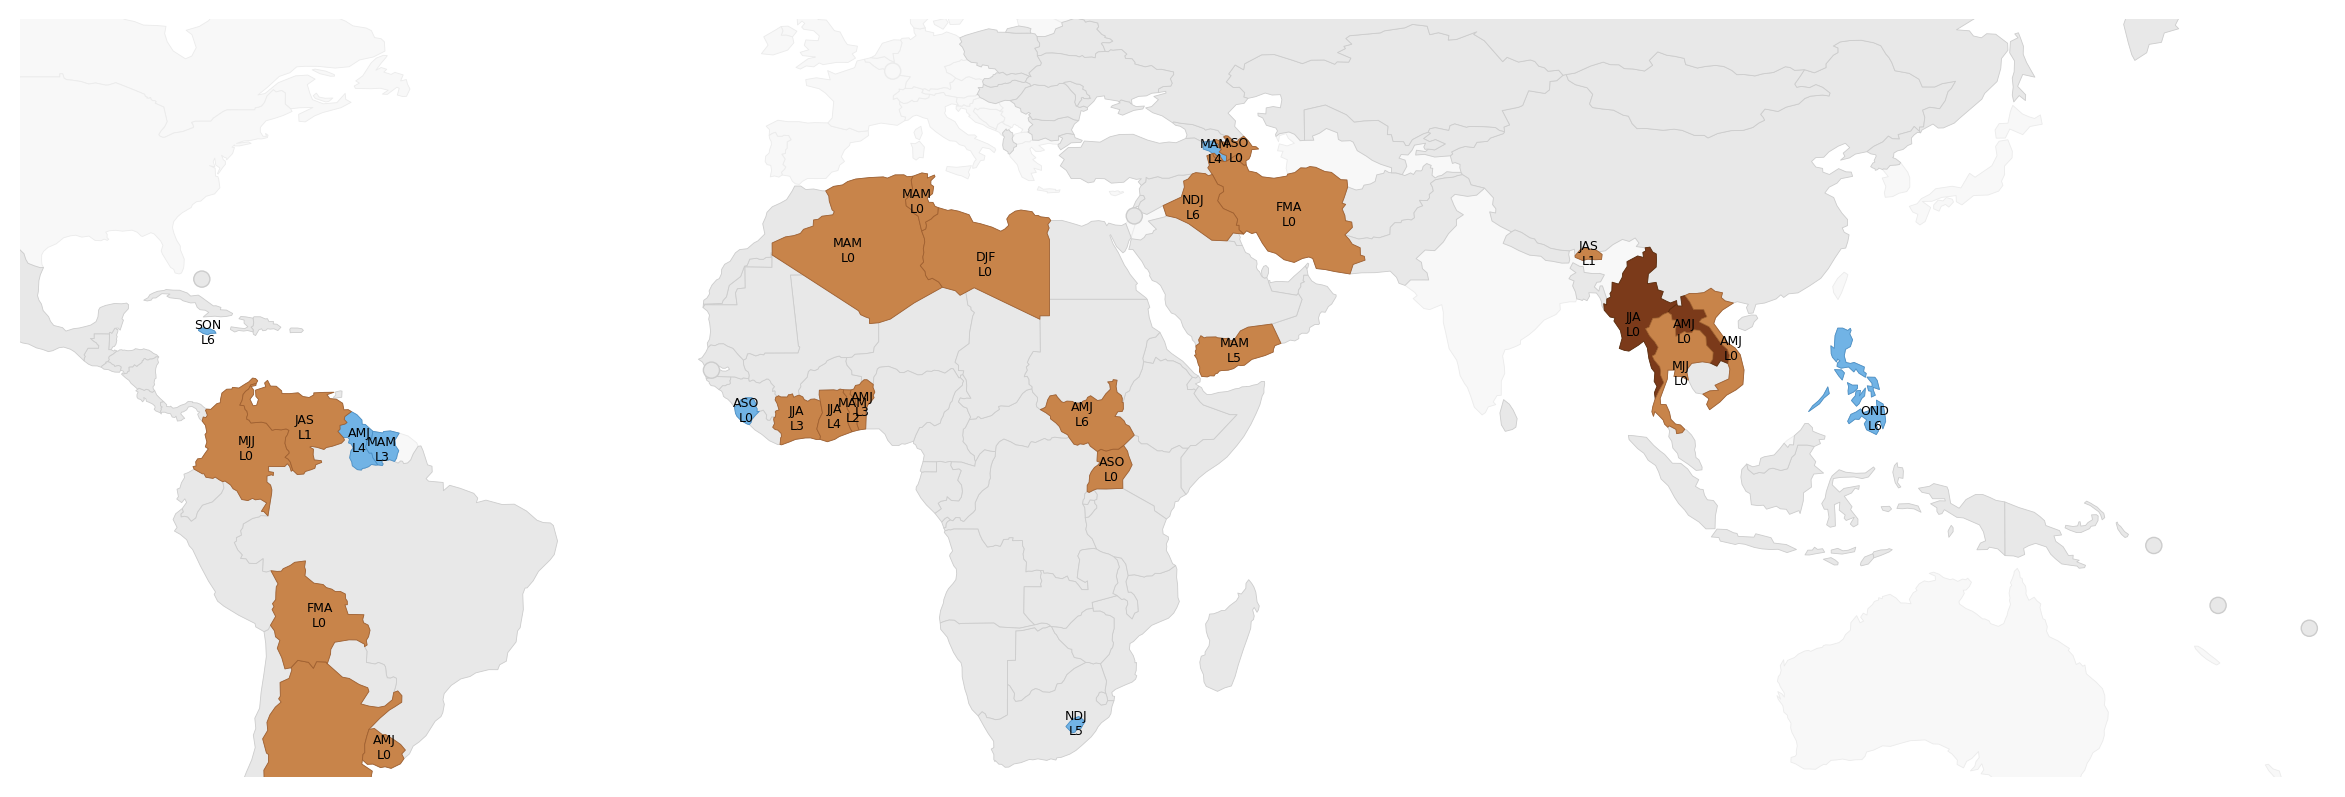
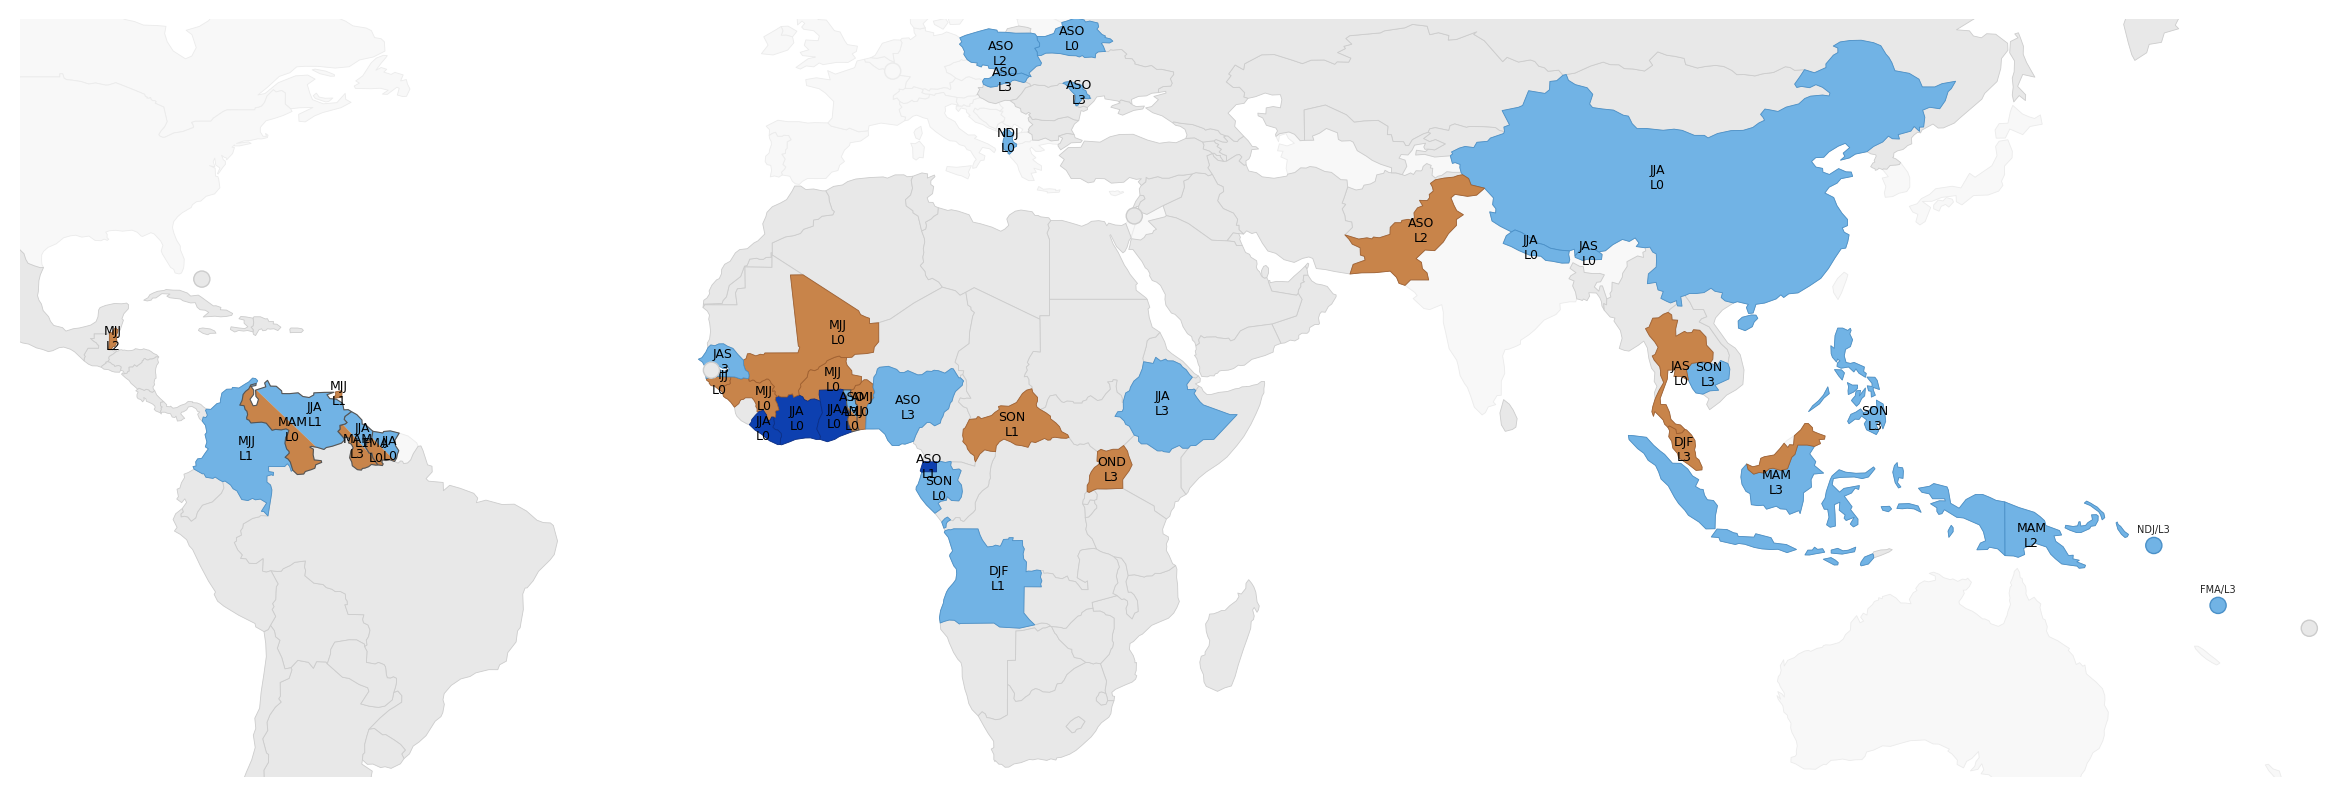
Correlation of Niño3.4 (ENSO) with total seasonal rainfall — unique signal (0–3 mo lag, country mean)

Unique signal — partial r, other climate modes held constant. Shrinkage vs Total = shared variance, not absent signal.

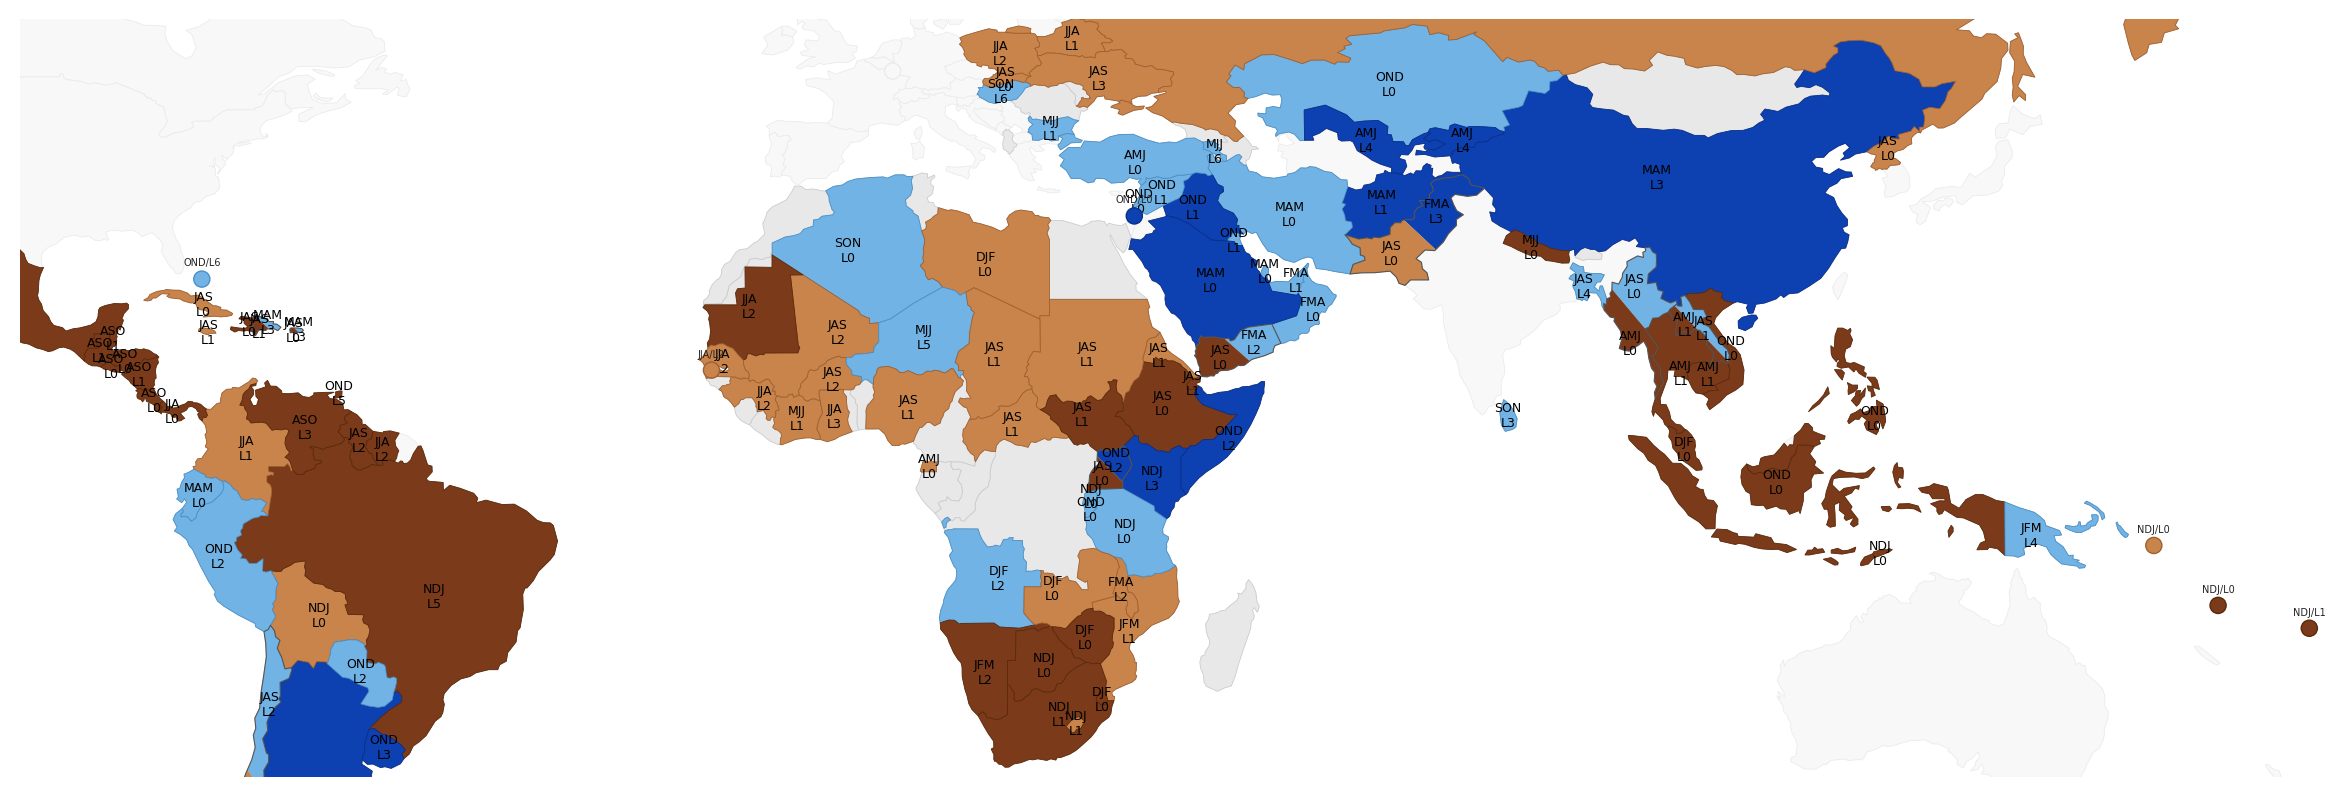
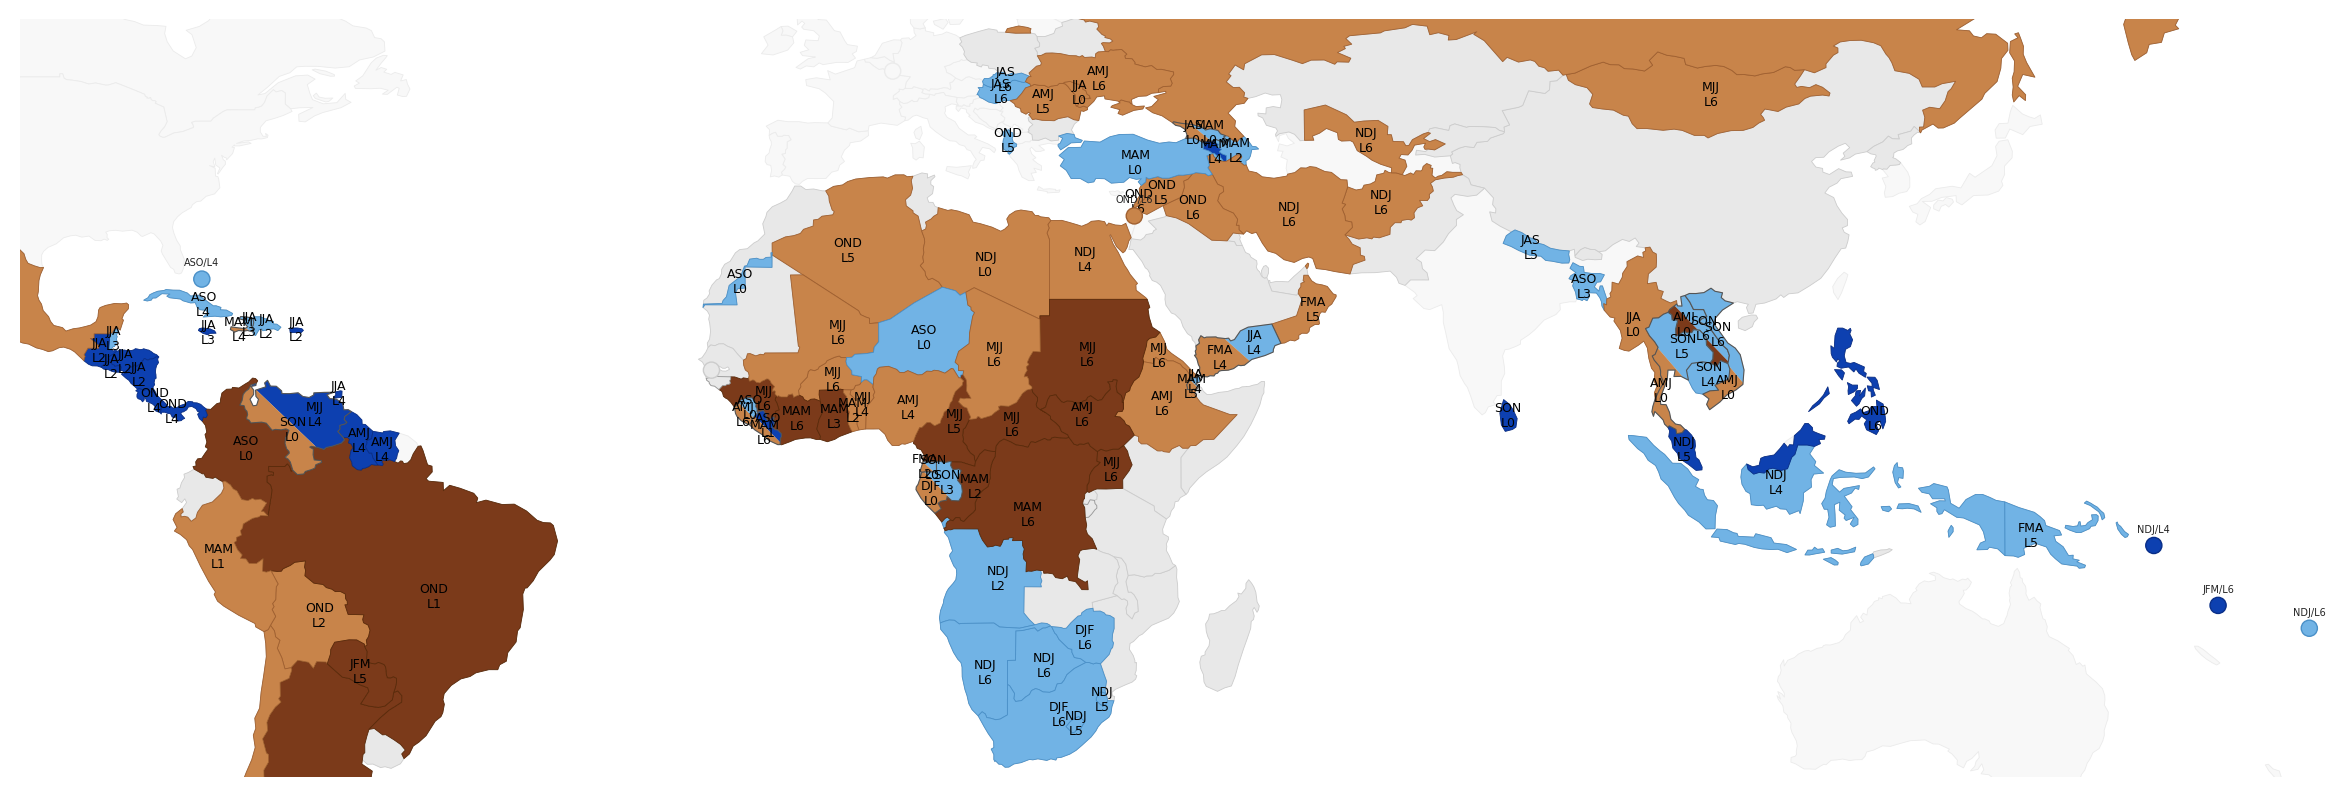
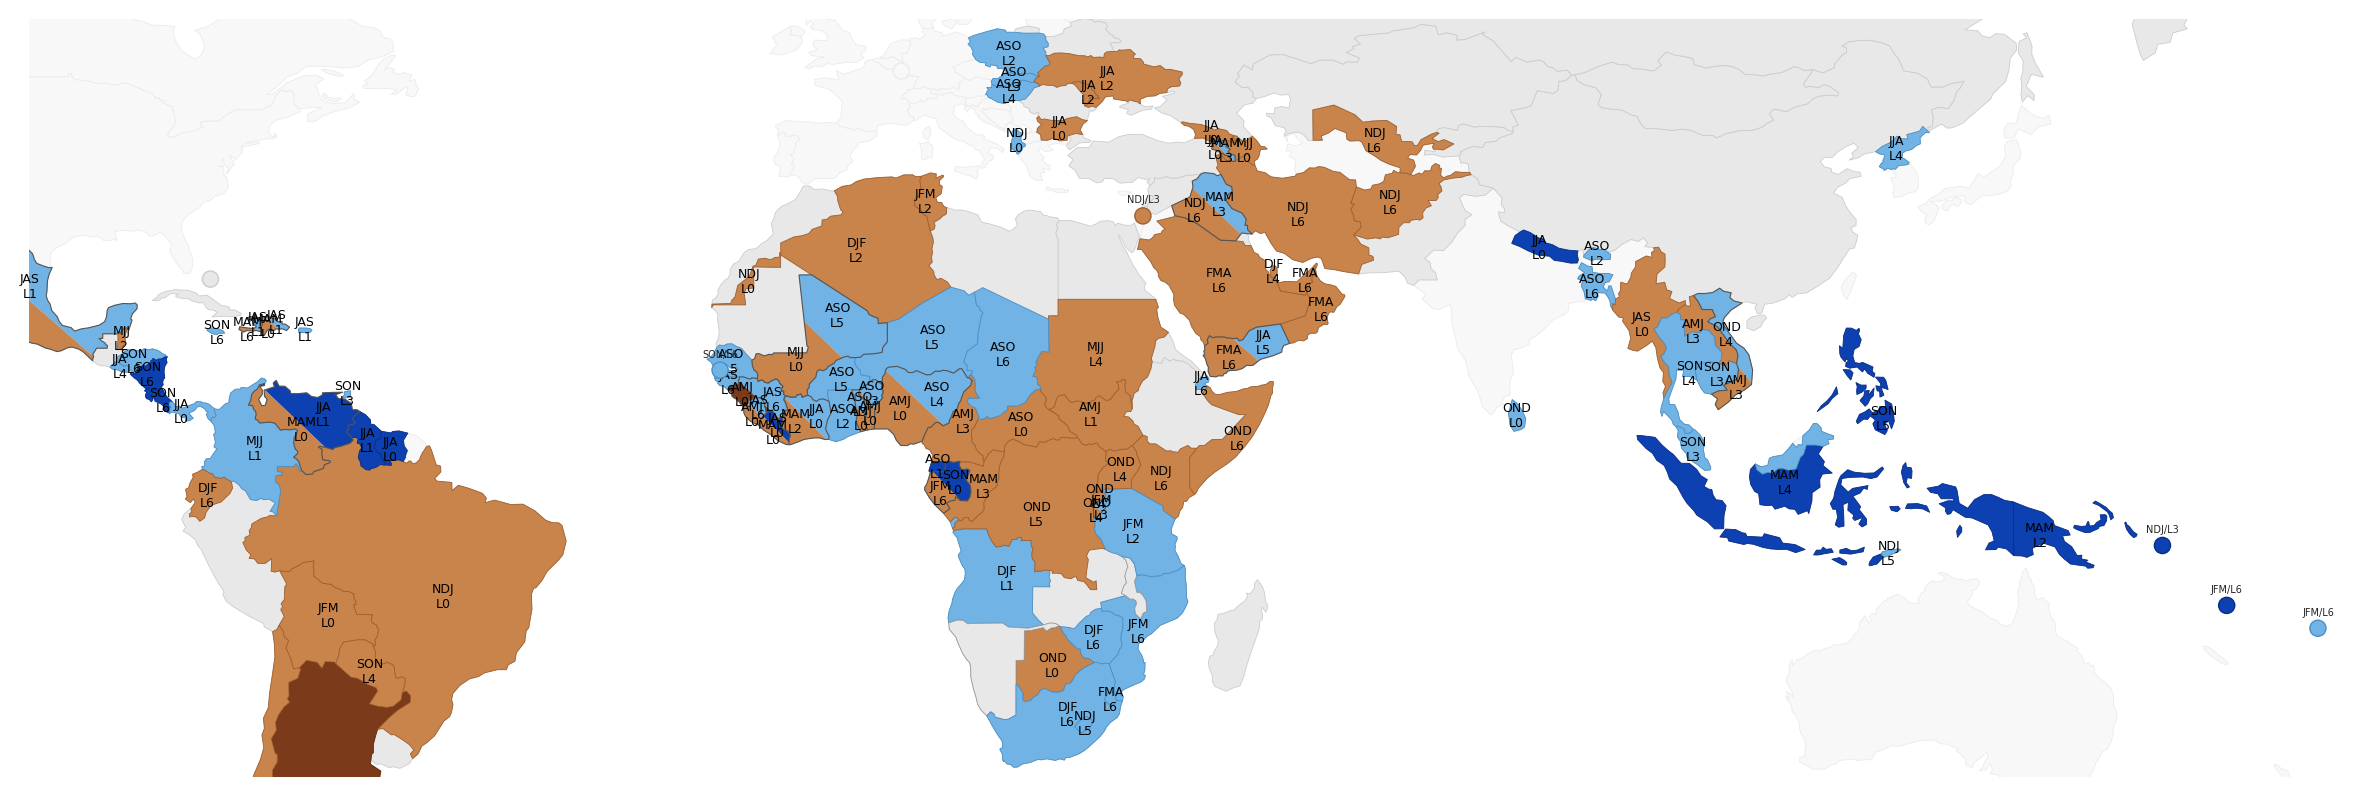
Correlation of Niño3.4 (ENSO) with total seasonal rainfall — total association (0–6 mo lag, country mean)

Total association — pairwise Pearson r, p<0.05. Split diagonal = significant in both directions across non-overlapping seasons.
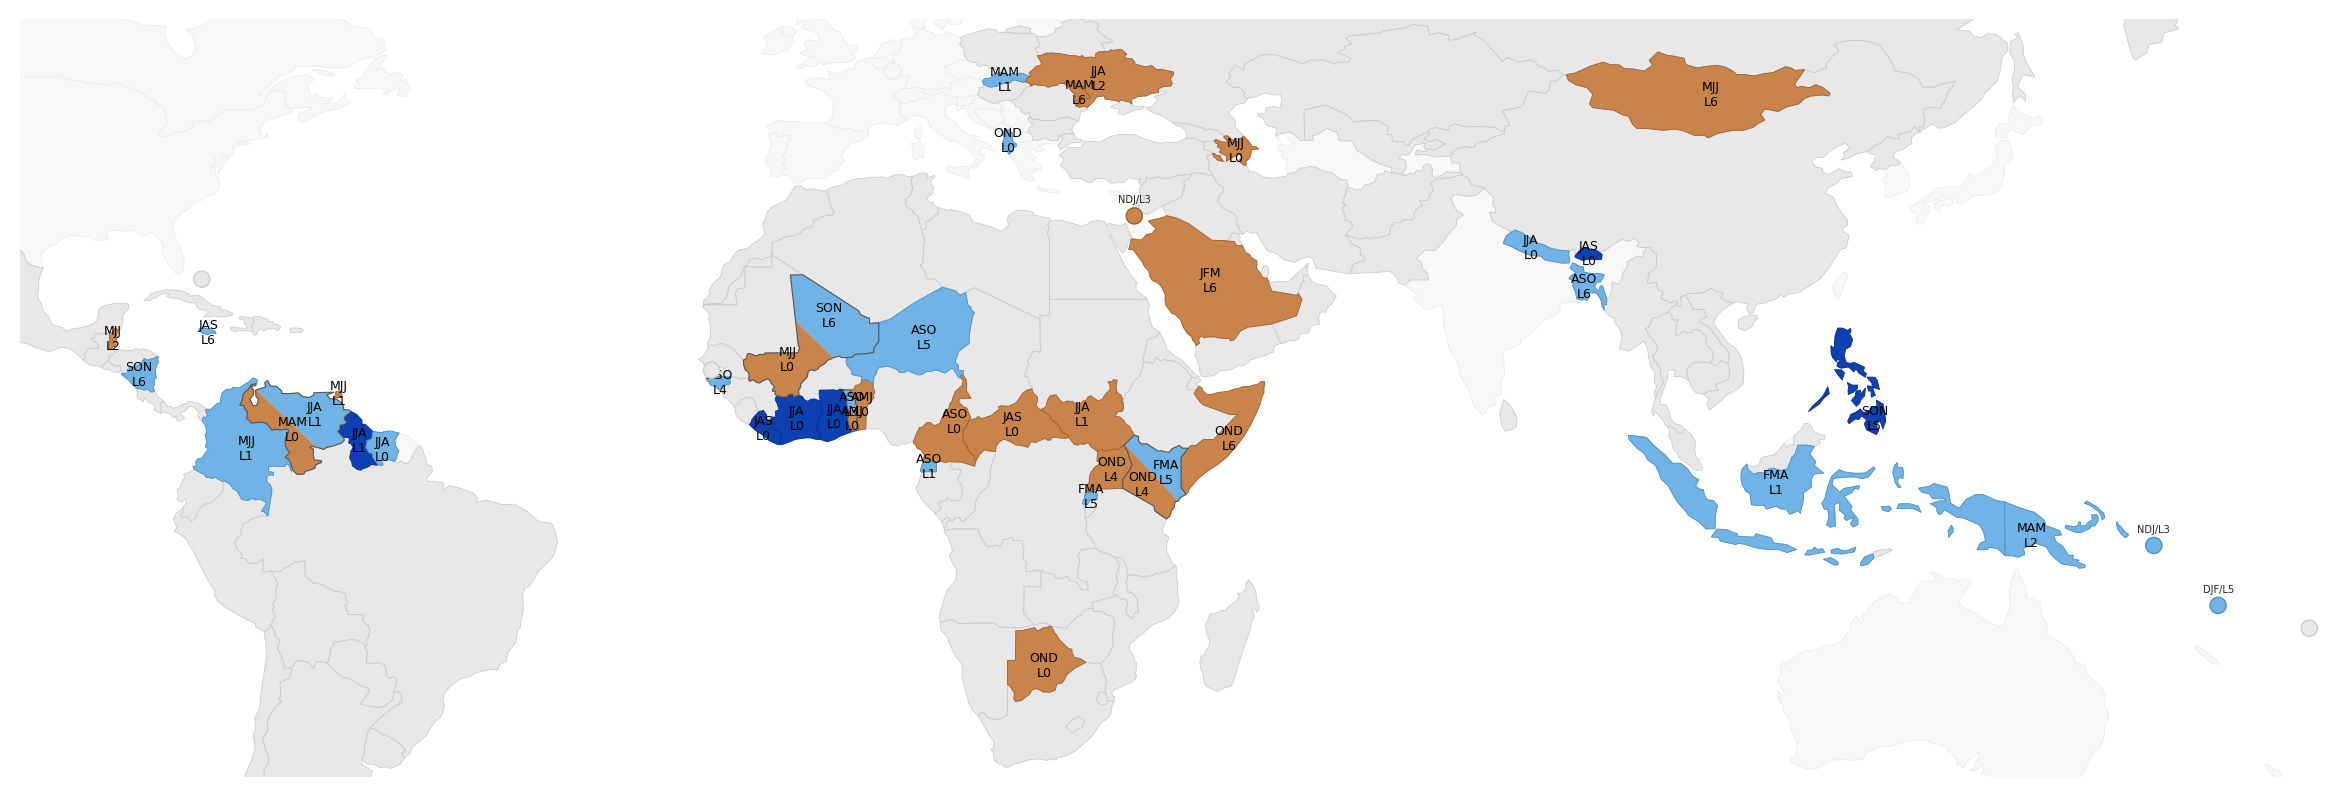
Correlation of Niño3.4 (ENSO) with total seasonal rainfall — unique signal (0–6 mo lag, country mean)

Unique signal — partial r, other climate modes held constant. Shrinkage vs Total = shared variance, not absent signal.

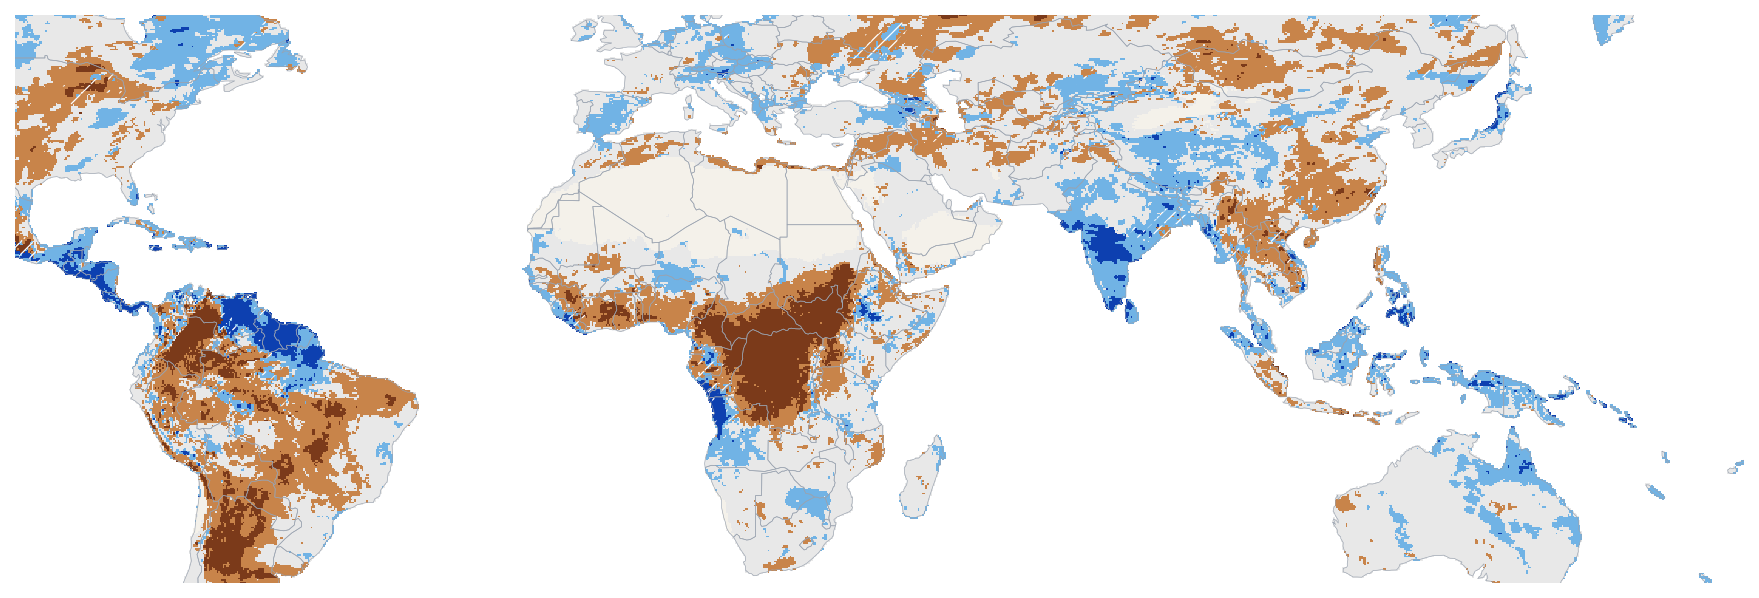
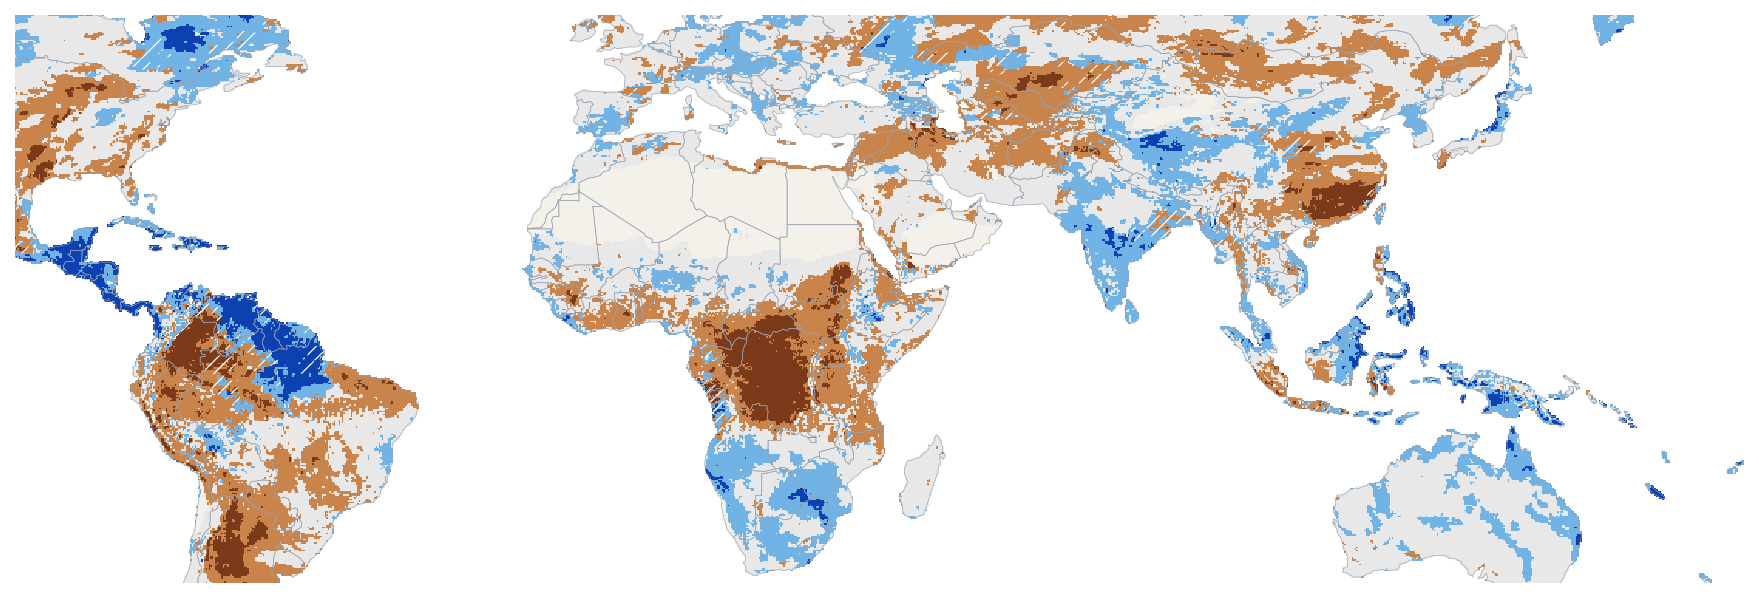
Correlation of Niño3.4 (ENSO) with total seasonal rainfall — total association (0–3 mo lag, 0.25° grid cell)

Total association — pairwise Pearson r, p<0.05. Hatching = significant in both directions across non-overlapping seasons; the fill shows the stronger of the two.

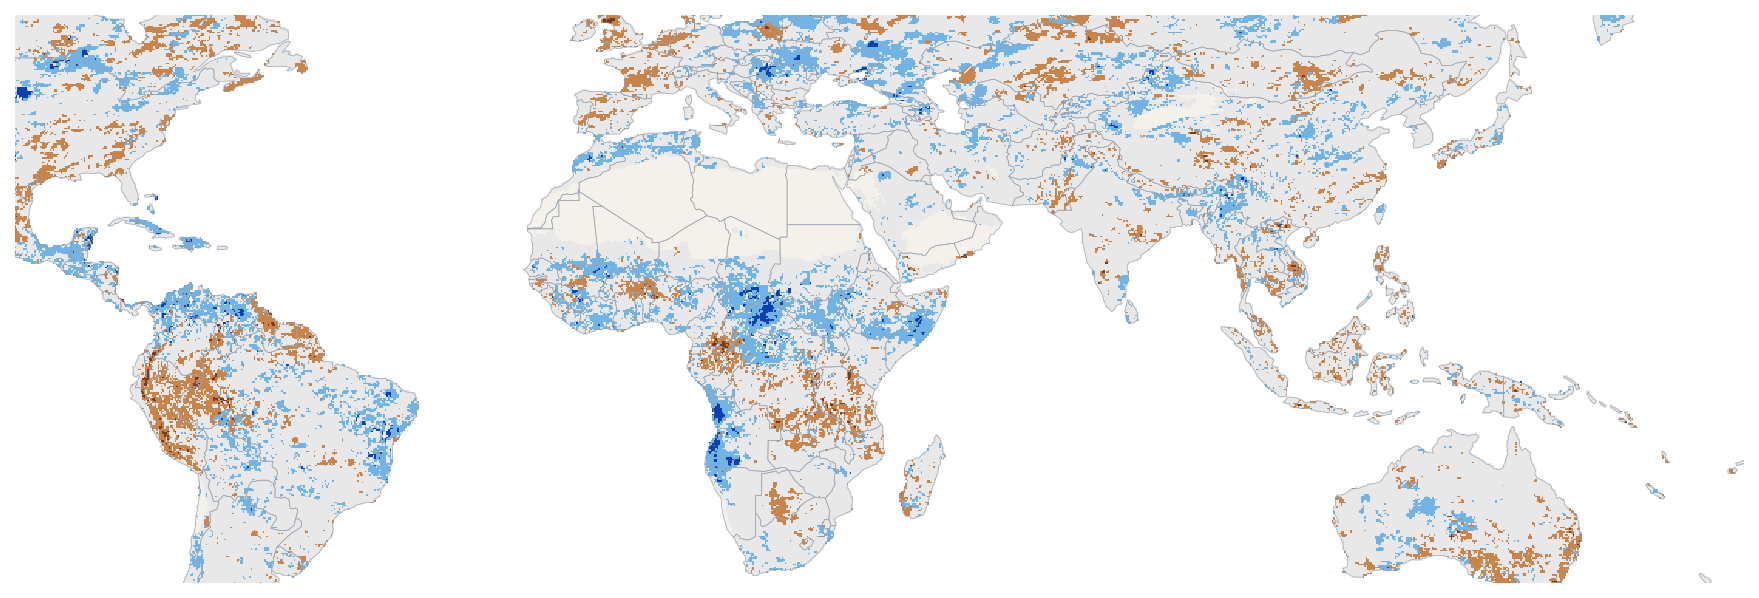
Correlation of Niño3.4 (ENSO) with total seasonal rainfall — unique signal (0–3 mo lag, 0.25° grid cell)

Unique signal — partial r, other climate modes held constant. Shrinkage vs Total = shared variance, not absent signal.

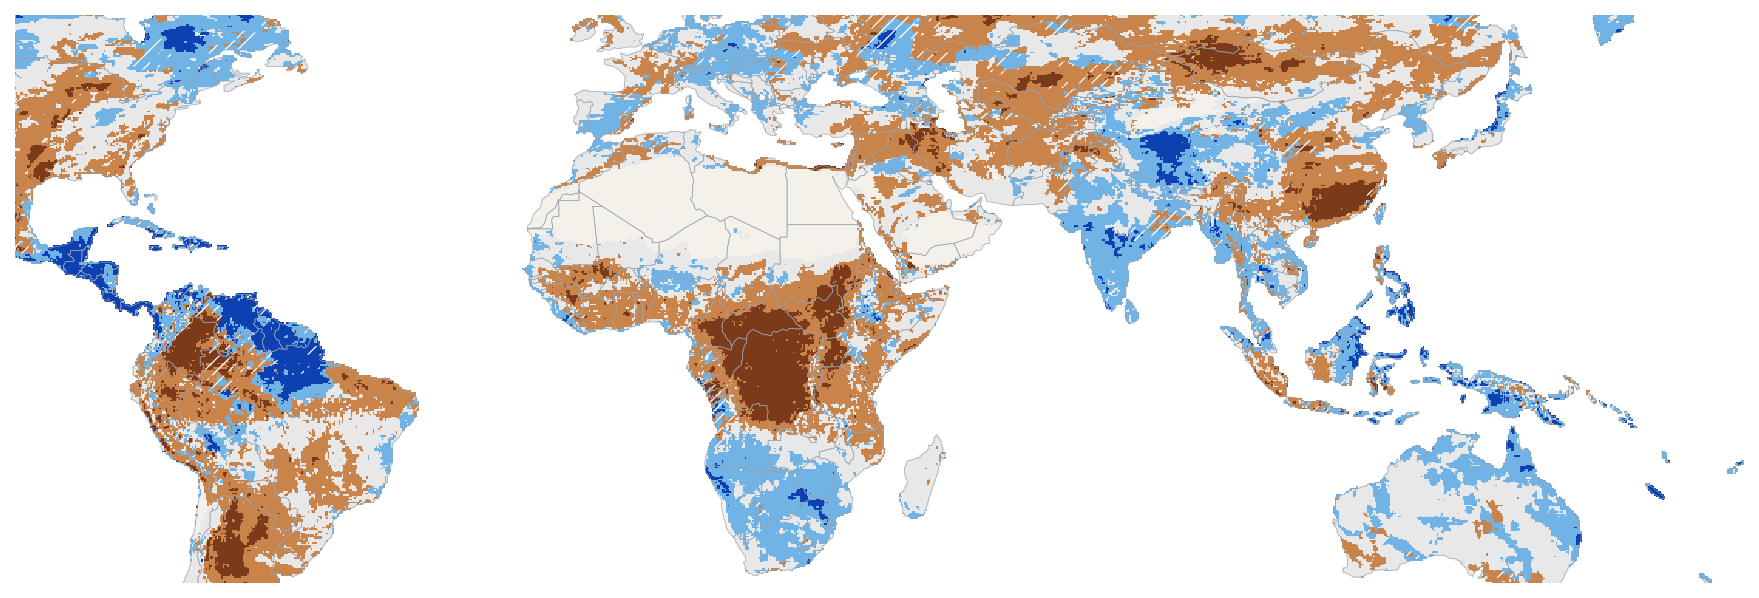
Correlation of Niño3.4 (ENSO) with total seasonal rainfall — total association (0–6 mo lag, 0.25° grid cell)

Total association — pairwise Pearson r, p<0.05. Hatching = significant in both directions across non-overlapping seasons; the fill shows the stronger of the two.

Correlation of Niño3.4 (ENSO) with total seasonal rainfall — unique signal (0–6 mo lag, 0.25° grid cell)

Unique signal — partial r, other climate modes held constant. Shrinkage vs Total = shared variance, not absent signal.

Correlation of IOD (Indian Ocean Dipole) with total seasonal rainfall — total association (0–3 mo lag, country mean)

Total association — pairwise Pearson r, p<0.05. Split diagonal = significant in both directions across non-overlapping seasons.
Correlation of IOD (Indian Ocean Dipole) with total seasonal rainfall — unique signal (0–3 mo lag, country mean)

Unique signal — partial r, other climate modes held constant. Shrinkage vs Total = shared variance, not absent signal.
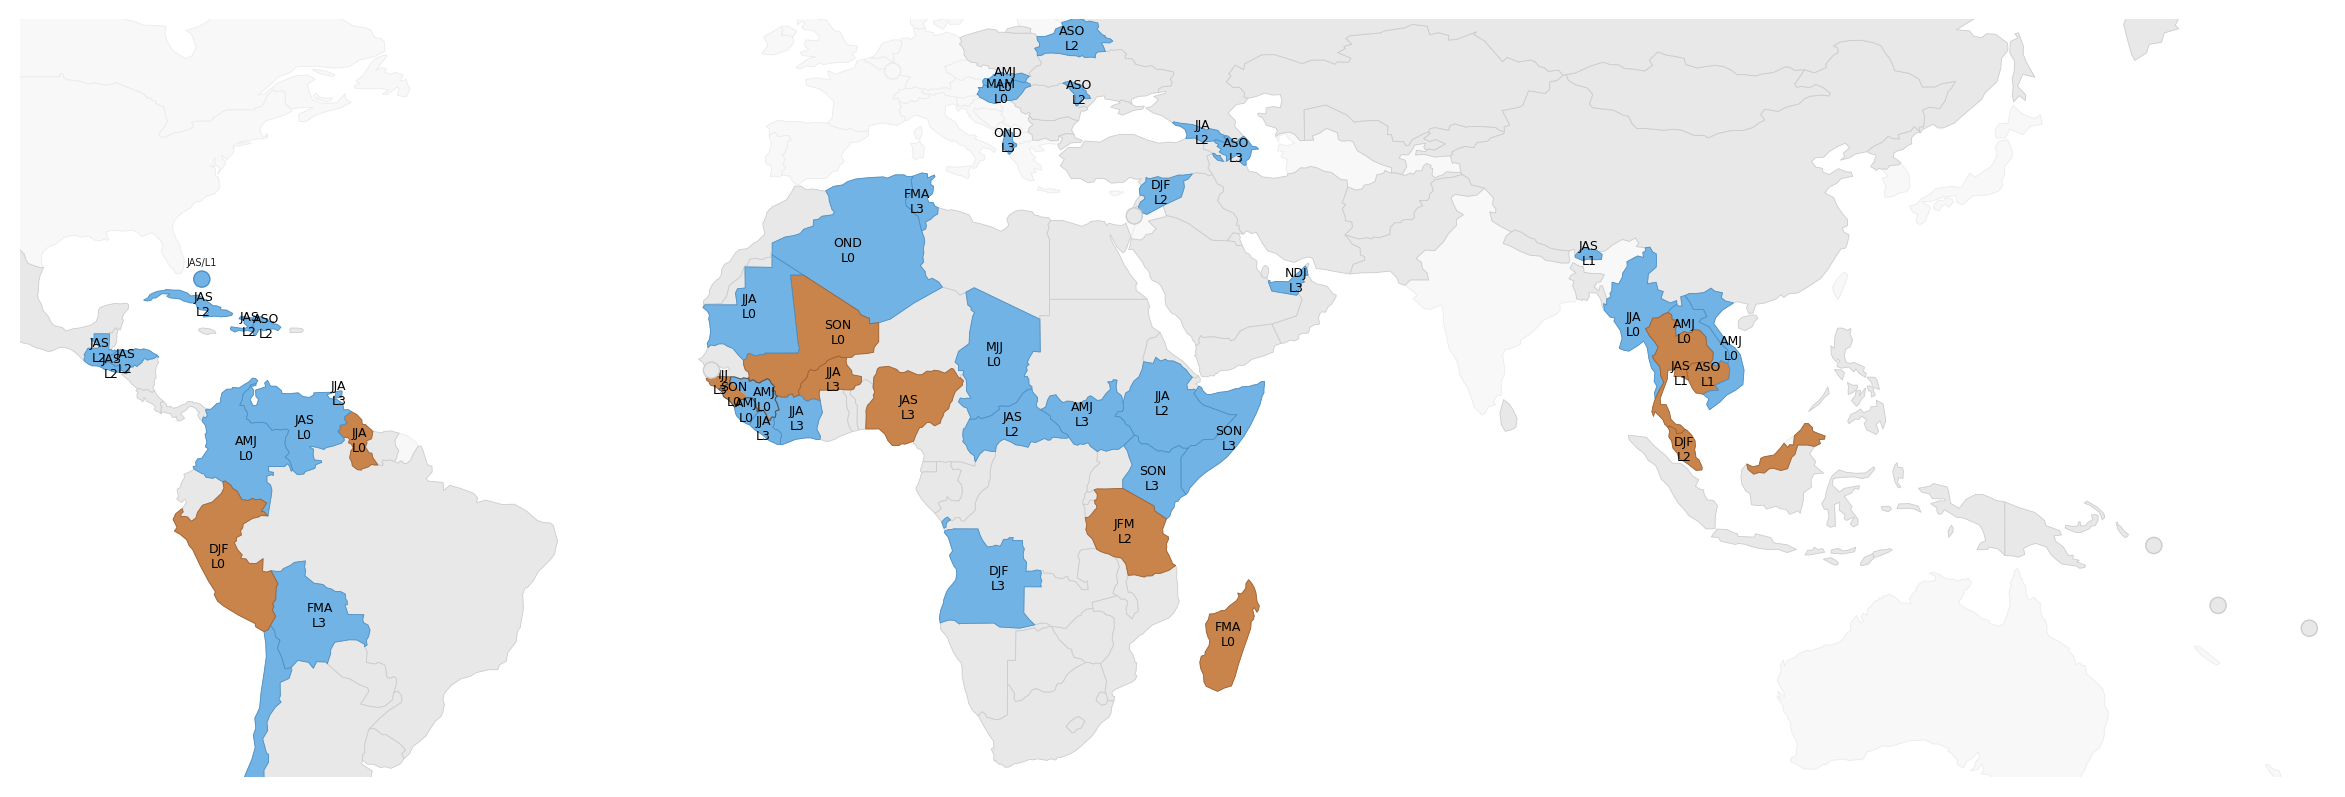
Correlation of IOD (Indian Ocean Dipole) with total seasonal rainfall — total association (0–6 mo lag, country mean)

Total association — pairwise Pearson r, p<0.05. Split diagonal = significant in both directions across non-overlapping seasons.

Correlation of IOD (Indian Ocean Dipole) with total seasonal rainfall — unique signal (0–6 mo lag, country mean)

Unique signal — partial r, other climate modes held constant. Shrinkage vs Total = shared variance, not absent signal.

Correlation of IOD (Indian Ocean Dipole) with total seasonal rainfall — total association (0–3 mo lag, 0.25° grid cell)

Total association — pairwise Pearson r, p<0.05. Hatching = significant in both directions across non-overlapping seasons; the fill shows the stronger of the two.

Correlation of IOD (Indian Ocean Dipole) with total seasonal rainfall — unique signal (0–3 mo lag, 0.25° grid cell)

Unique signal — partial r, other climate modes held constant. Shrinkage vs Total = shared variance, not absent signal.

Correlation of IOD (Indian Ocean Dipole) with total seasonal rainfall — total association (0–6 mo lag, 0.25° grid cell)

Total association — pairwise Pearson r, p<0.05. Hatching = significant in both directions across non-overlapping seasons; the fill shows the stronger of the two.

Correlation of IOD (Indian Ocean Dipole) with total seasonal rainfall — unique signal (0–6 mo lag, 0.25° grid cell)

Unique signal — partial r, other climate modes held constant. Shrinkage vs Total = shared variance, not absent signal.

Correlation of TNA (Tropical N. Atlantic) with total seasonal rainfall — total association (0–3 mo lag, country mean)

Total association — pairwise Pearson r, p<0.05. Split diagonal = significant in both directions across non-overlapping seasons.

Correlation of TNA (Tropical N. Atlantic) with total seasonal rainfall — unique signal (0–3 mo lag, country mean)

Unique signal — partial r, other climate modes held constant. Shrinkage vs Total = shared variance, not absent signal.

Correlation of TNA (Tropical N. Atlantic) with total seasonal rainfall — total association (0–6 mo lag, country mean)

Total association — pairwise Pearson r, p<0.05. Split diagonal = significant in both directions across non-overlapping seasons.

Correlation of TNA (Tropical N. Atlantic) with total seasonal rainfall — unique signal (0–6 mo lag, country mean)

Unique signal — partial r, other climate modes held constant. Shrinkage vs Total = shared variance, not absent signal.

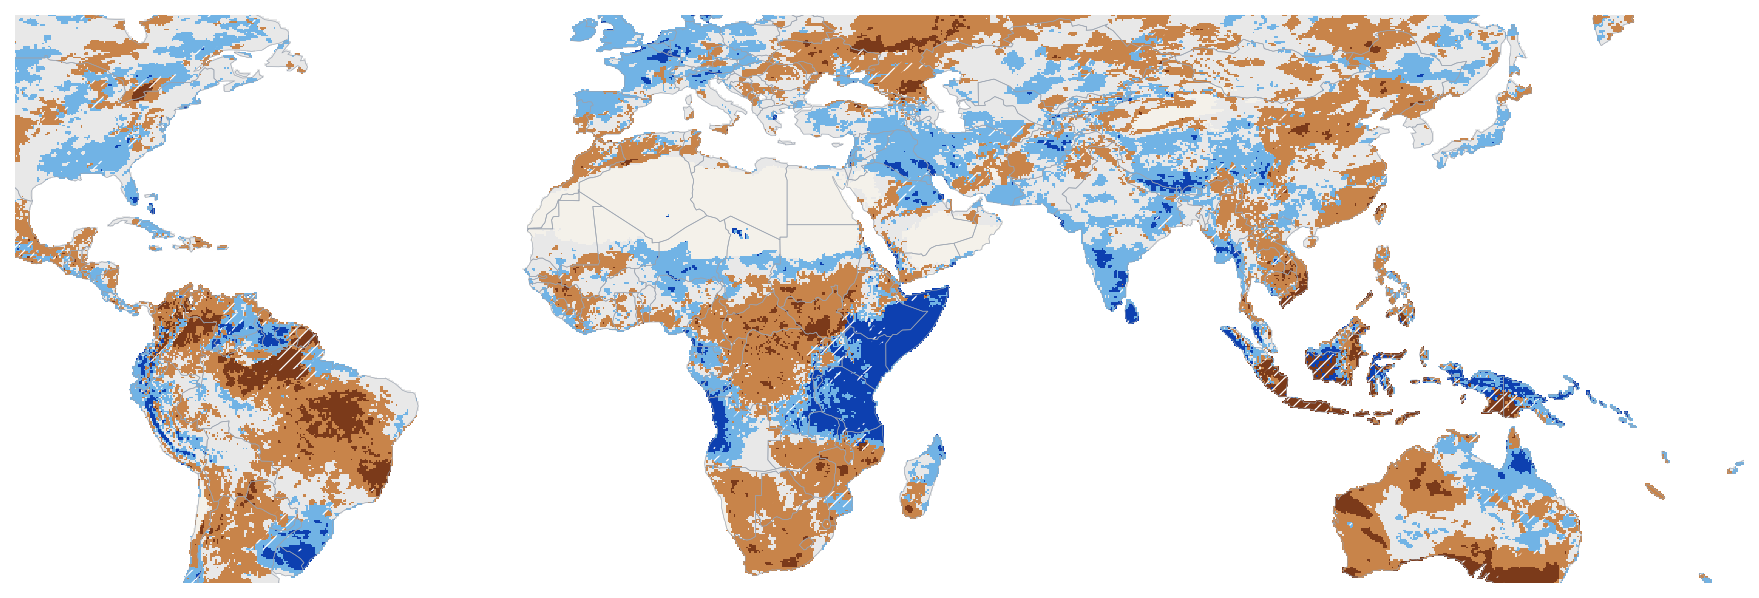
Correlation of TNA (Tropical N. Atlantic) with total seasonal rainfall — total association (0–3 mo lag, 0.25° grid cell)

Total association — pairwise Pearson r, p<0.05. Hatching = significant in both directions across non-overlapping seasons; the fill shows the stronger of the two.

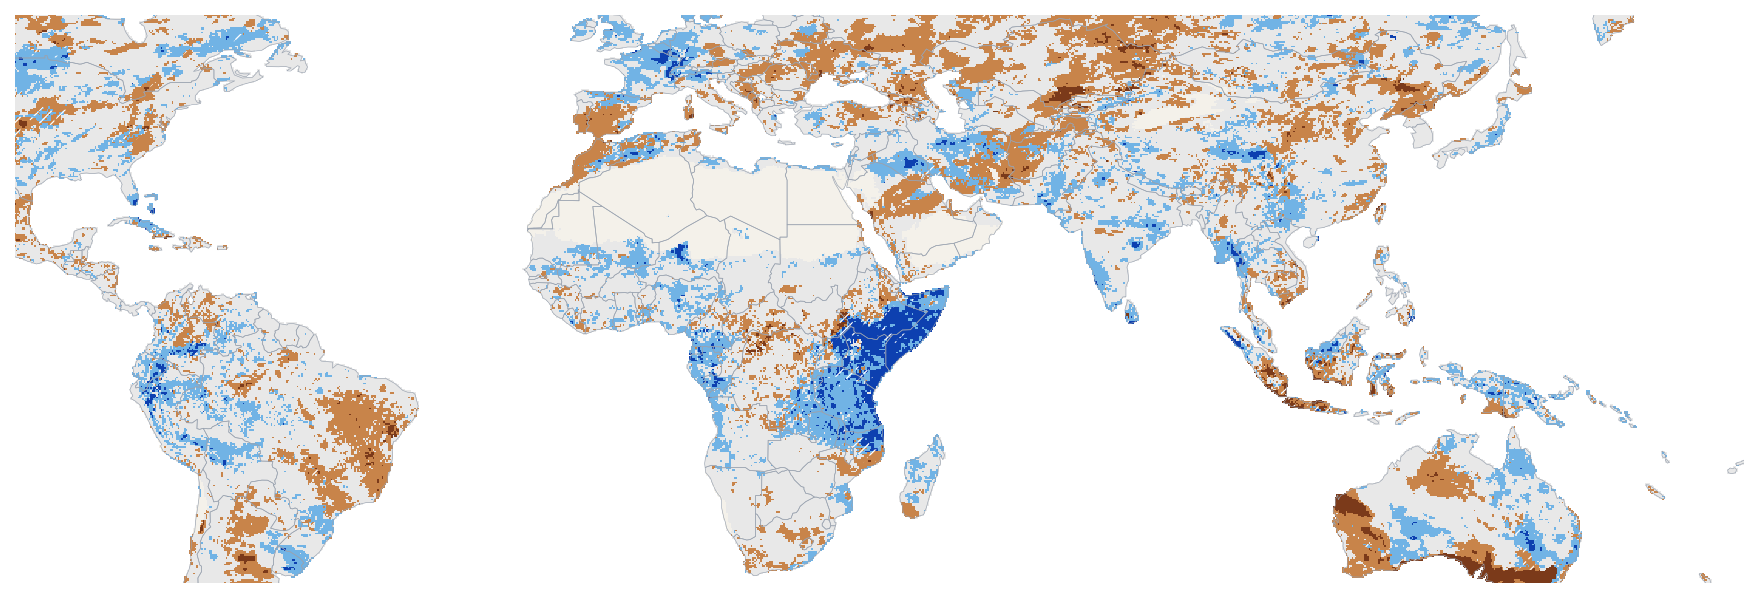
Correlation of TNA (Tropical N. Atlantic) with total seasonal rainfall — unique signal (0–3 mo lag, 0.25° grid cell)

Unique signal — partial r, other climate modes held constant. Shrinkage vs Total = shared variance, not absent signal.

Correlation of TNA (Tropical N. Atlantic) with total seasonal rainfall — total association (0–6 mo lag, 0.25° grid cell)

Total association — pairwise Pearson r, p<0.05. Hatching = significant in both directions across non-overlapping seasons; the fill shows the stronger of the two.

Correlation of TNA (Tropical N. Atlantic) with total seasonal rainfall — unique signal (0–6 mo lag, 0.25° grid cell)

Unique signal — partial r, other climate modes held constant. Shrinkage vs Total = shared variance, not absent signal.

Correlation of TSA (Tropical S. Atlantic) with total seasonal rainfall — total association (0–3 mo lag, country mean)

Total association — pairwise Pearson r, p<0.05. Split diagonal = significant in both directions across non-overlapping seasons.

Correlation of TSA (Tropical S. Atlantic) with total seasonal rainfall — unique signal (0–3 mo lag, country mean)

Unique signal — partial r, other climate modes held constant. Shrinkage vs Total = shared variance, not absent signal.

Correlation of TSA (Tropical S. Atlantic) with total seasonal rainfall — total association (0–6 mo lag, country mean)

Total association — pairwise Pearson r, p<0.05. Split diagonal = significant in both directions across non-overlapping seasons.

Correlation of TSA (Tropical S. Atlantic) with total seasonal rainfall — unique signal (0–6 mo lag, country mean)

Unique signal — partial r, other climate modes held constant. Shrinkage vs Total = shared variance, not absent signal.

Correlation of TSA (Tropical S. Atlantic) with total seasonal rainfall — total association (0–3 mo lag, 0.25° grid cell)

Total association — pairwise Pearson r, p<0.05. Hatching = significant in both directions across non-overlapping seasons; the fill shows the stronger of the two.

Correlation of TSA (Tropical S. Atlantic) with total seasonal rainfall — unique signal (0–3 mo lag, 0.25° grid cell)

Unique signal — partial r, other climate modes held constant. Shrinkage vs Total = shared variance, not absent signal.

Correlation of TSA (Tropical S. Atlantic) with total seasonal rainfall — total association (0–6 mo lag, 0.25° grid cell)

Total association — pairwise Pearson r, p<0.05. Hatching = significant in both directions across non-overlapping seasons; the fill shows the stronger of the two.

Correlation of TSA (Tropical S. Atlantic) with total seasonal rainfall — unique signal (0–6 mo lag, 0.25° grid cell)

Unique signal — partial r, other climate modes held constant. Shrinkage vs Total = shared variance, not absent signal.

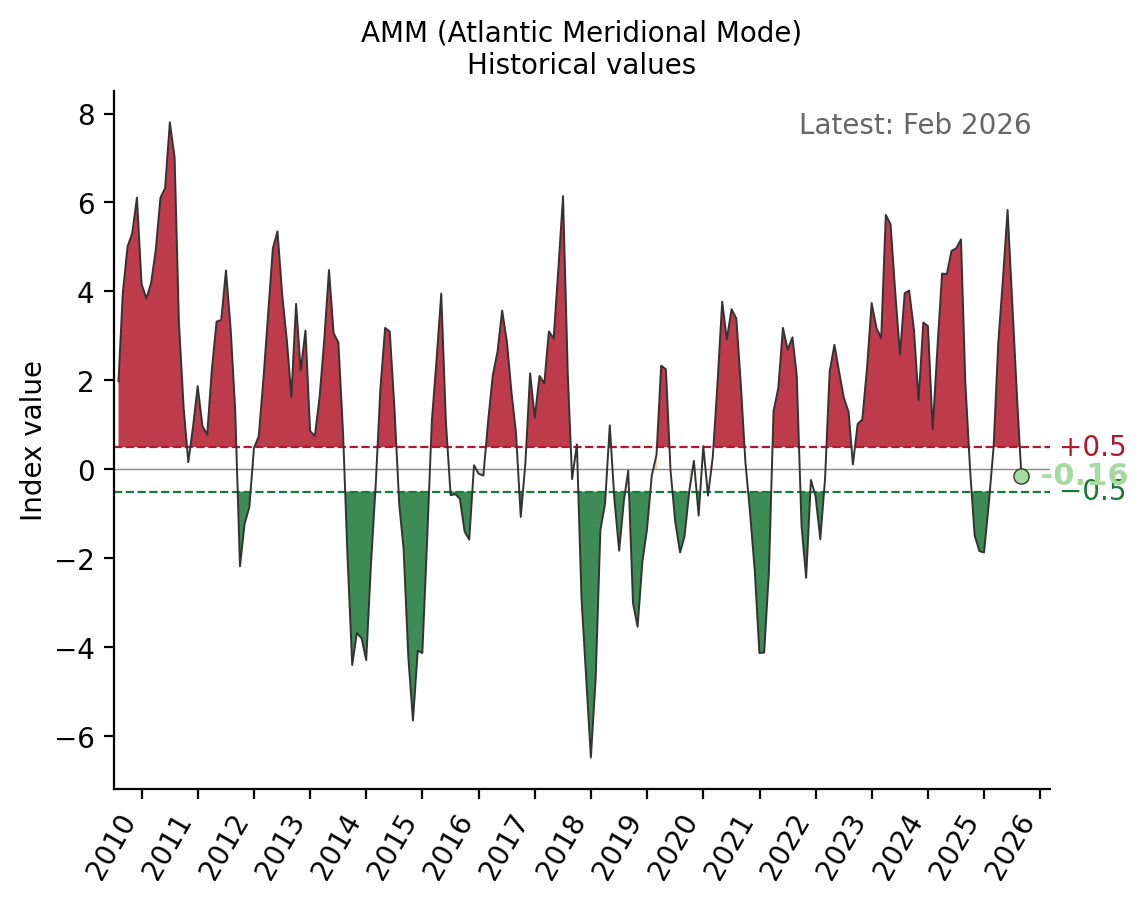
Correlation of AMM (Atlantic Meridional Mode) with total seasonal rainfall — total association (0–3 mo lag, country mean)

Total association — pairwise Pearson r, p<0.05. Split diagonal = significant in both directions across non-overlapping seasons.

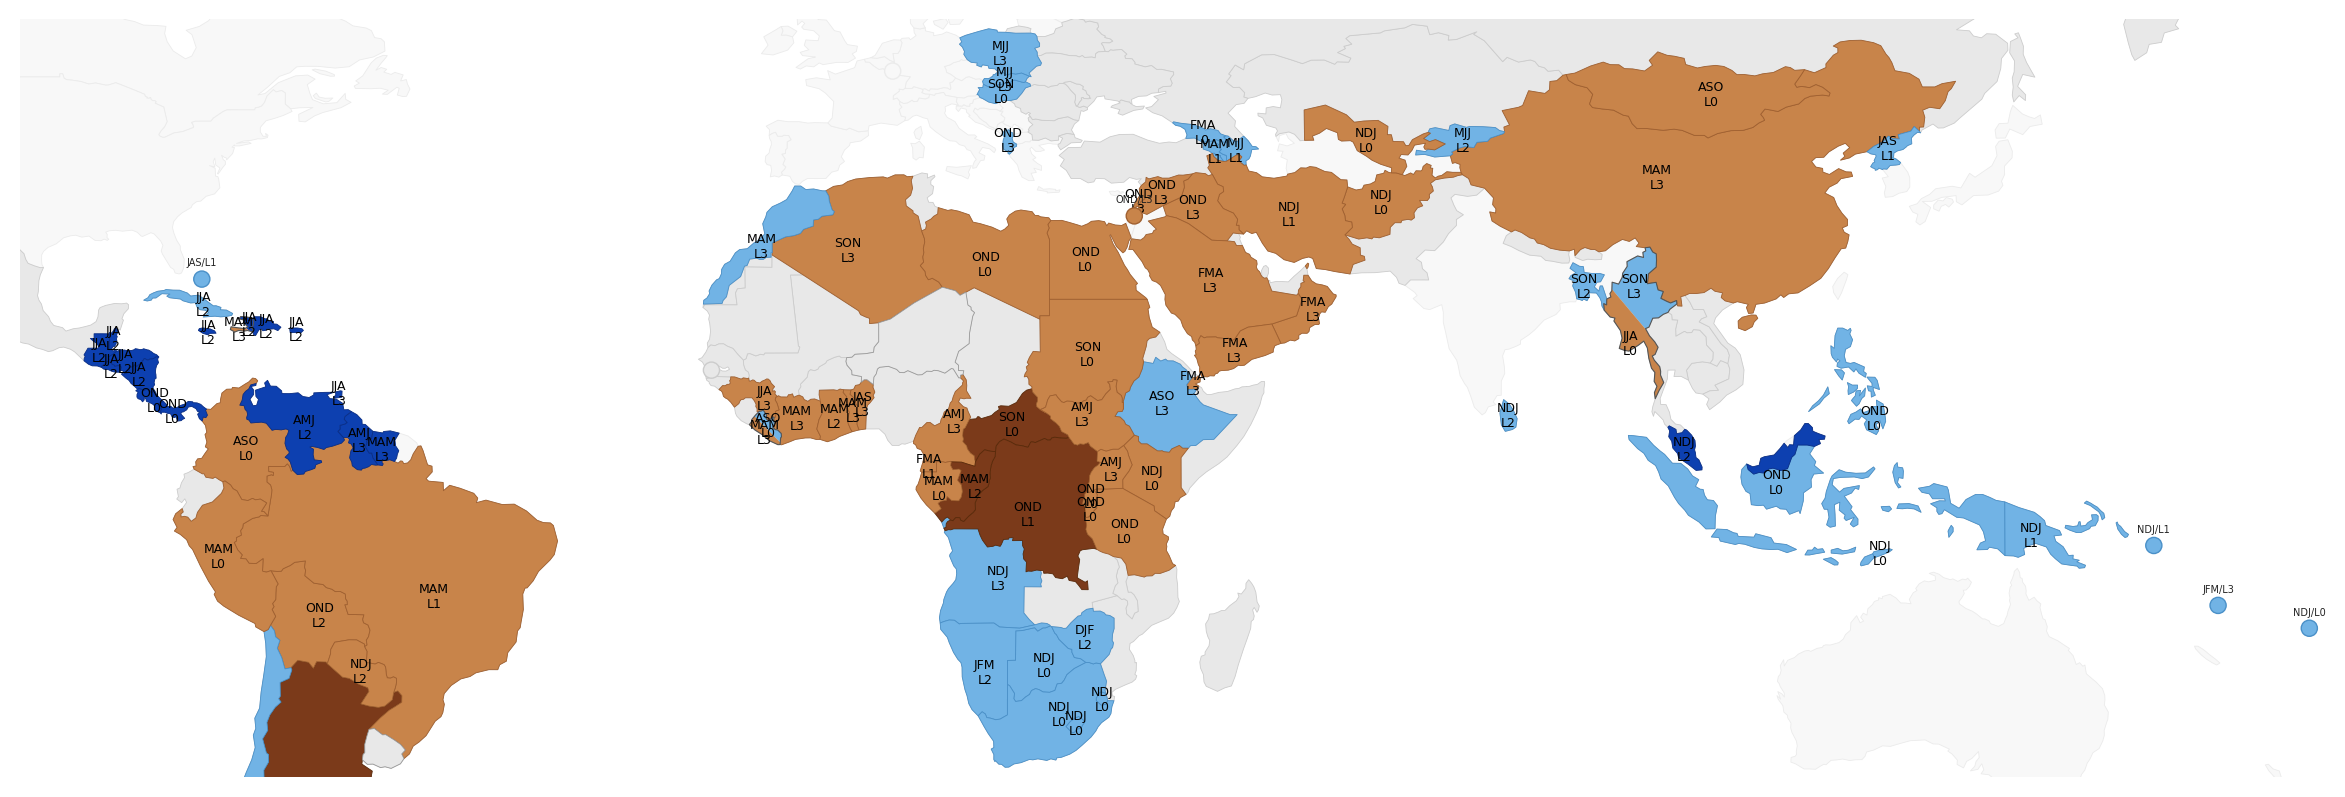
Correlation of AMM (Atlantic Meridional Mode) with total seasonal rainfall — unique signal (0–3 mo lag, country mean)

Unique signal — partial r, other climate modes held constant. Shrinkage vs Total = shared variance, not absent signal.

Correlation of AMM (Atlantic Meridional Mode) with total seasonal rainfall — total association (0–6 mo lag, country mean)

Total association — pairwise Pearson r, p<0.05. Split diagonal = significant in both directions across non-overlapping seasons.

Correlation of AMM (Atlantic Meridional Mode) with total seasonal rainfall — unique signal (0–6 mo lag, country mean)

Unique signal — partial r, other climate modes held constant. Shrinkage vs Total = shared variance, not absent signal.

Correlation of AMM (Atlantic Meridional Mode) with total seasonal rainfall — total association (0–3 mo lag, 0.25° grid cell)

Total association — pairwise Pearson r, p<0.05. Hatching = significant in both directions across non-overlapping seasons; the fill shows the stronger of the two.

Correlation of AMM (Atlantic Meridional Mode) with total seasonal rainfall — unique signal (0–3 mo lag, 0.25° grid cell)

Unique signal — partial r, other climate modes held constant. Shrinkage vs Total = shared variance, not absent signal.

Correlation of AMM (Atlantic Meridional Mode) with total seasonal rainfall — total association (0–6 mo lag, 0.25° grid cell)

Total association — pairwise Pearson r, p<0.05. Hatching = significant in both directions across non-overlapping seasons; the fill shows the stronger of the two.

Correlation of AMM (Atlantic Meridional Mode) with total seasonal rainfall — unique signal (0–6 mo lag, 0.25° grid cell)

Unique signal — partial r, other climate modes held constant. Shrinkage vs Total = shared variance, not absent signal.

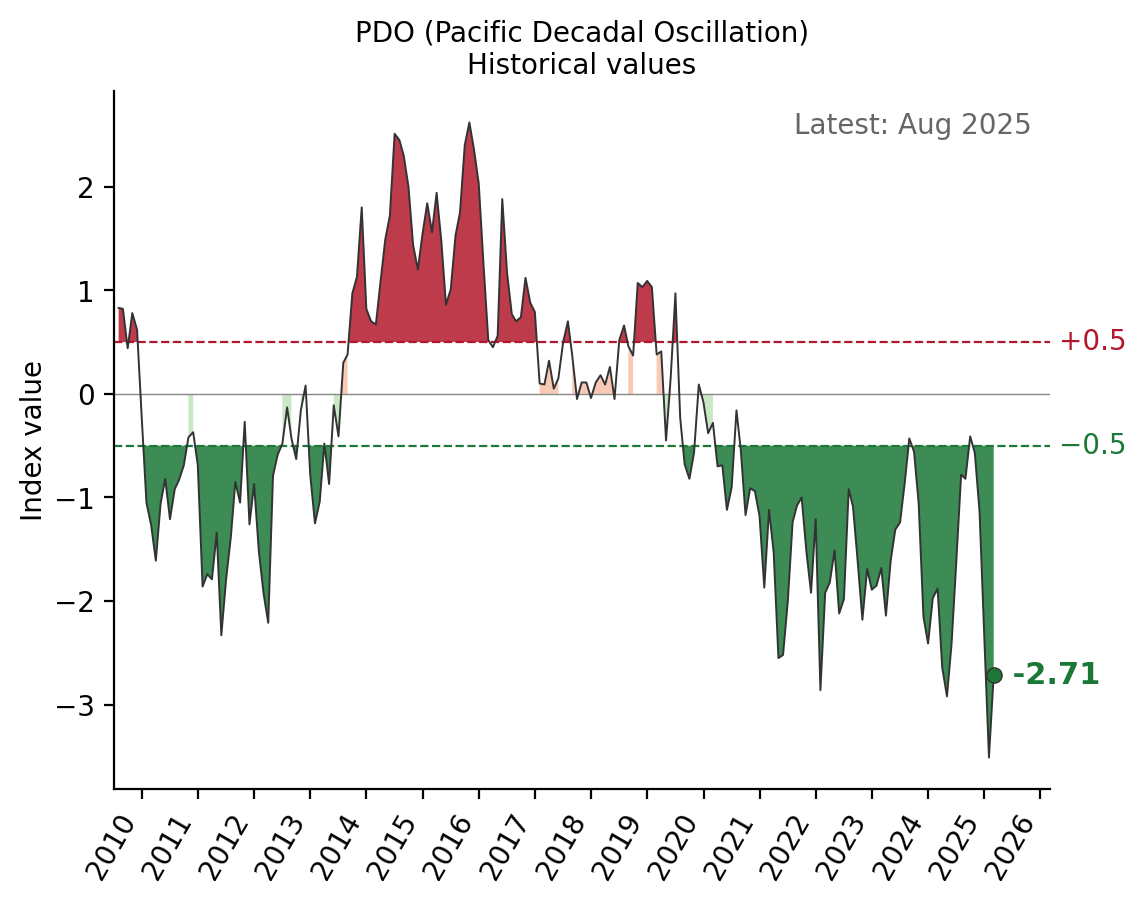
Correlation of PDO (Pacific Decadal Oscillation) with total seasonal rainfall — total association (0–3 mo lag, country mean)

Total association — pairwise Pearson r, p<0.05. Split diagonal = significant in both directions across non-overlapping seasons.

Correlation of PDO (Pacific Decadal Oscillation) with total seasonal rainfall — unique signal (0–3 mo lag, country mean)

Unique signal — partial r, other climate modes held constant. Shrinkage vs Total = shared variance, not absent signal.

Correlation of PDO (Pacific Decadal Oscillation) with total seasonal rainfall — total association (0–6 mo lag, country mean)

Total association — pairwise Pearson r, p<0.05. Split diagonal = significant in both directions across non-overlapping seasons.

Correlation of PDO (Pacific Decadal Oscillation) with total seasonal rainfall — unique signal (0–6 mo lag, country mean)

Unique signal — partial r, other climate modes held constant. Shrinkage vs Total = shared variance, not absent signal.

Correlation of PDO (Pacific Decadal Oscillation) with total seasonal rainfall — total association (0–3 mo lag, 0.25° grid cell)

Total association — pairwise Pearson r, p<0.05. Hatching = significant in both directions across non-overlapping seasons; the fill shows the stronger of the two.

Correlation of PDO (Pacific Decadal Oscillation) with total seasonal rainfall — unique signal (0–3 mo lag, 0.25° grid cell)

Unique signal — partial r, other climate modes held constant. Shrinkage vs Total = shared variance, not absent signal.

Correlation of PDO (Pacific Decadal Oscillation) with total seasonal rainfall — total association (0–6 mo lag, 0.25° grid cell)

Total association — pairwise Pearson r, p<0.05. Hatching = significant in both directions across non-overlapping seasons; the fill shows the stronger of the two.

Correlation of PDO (Pacific Decadal Oscillation) with total seasonal rainfall — unique signal (0–6 mo lag, 0.25° grid cell)

Unique signal — partial r, other climate modes held constant. Shrinkage vs Total = shared variance, not absent signal.
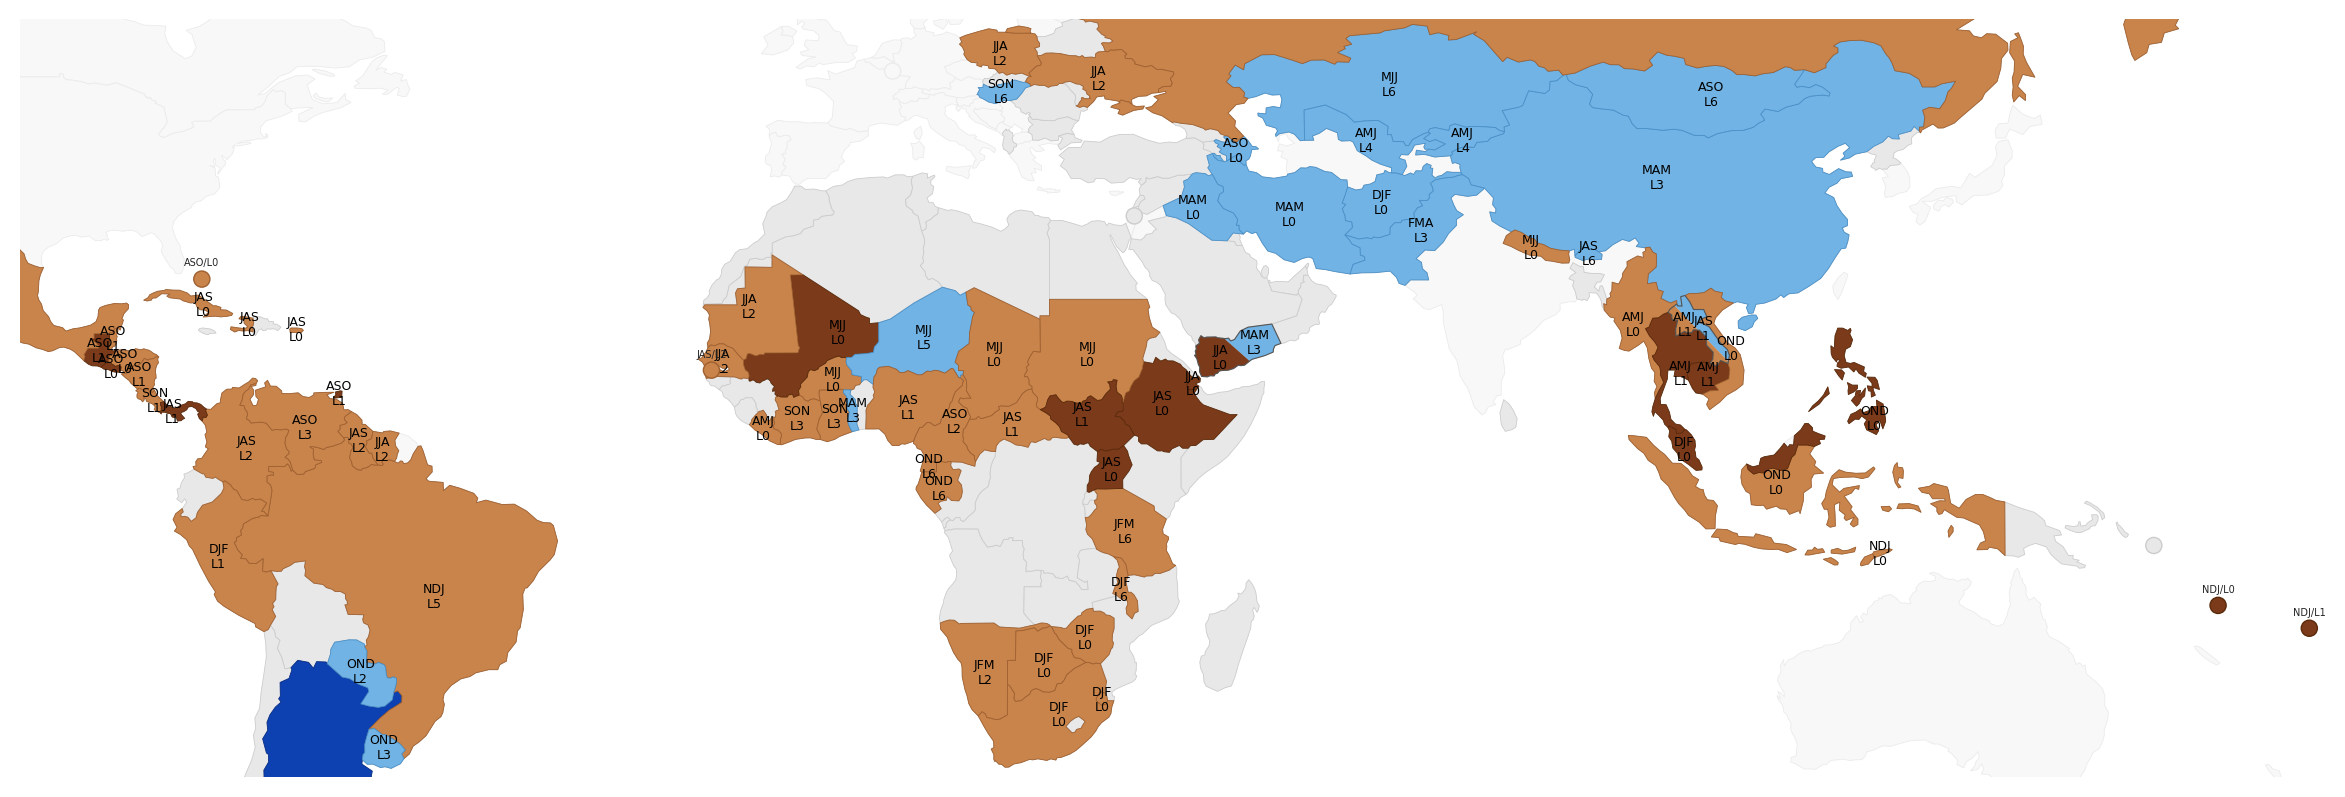
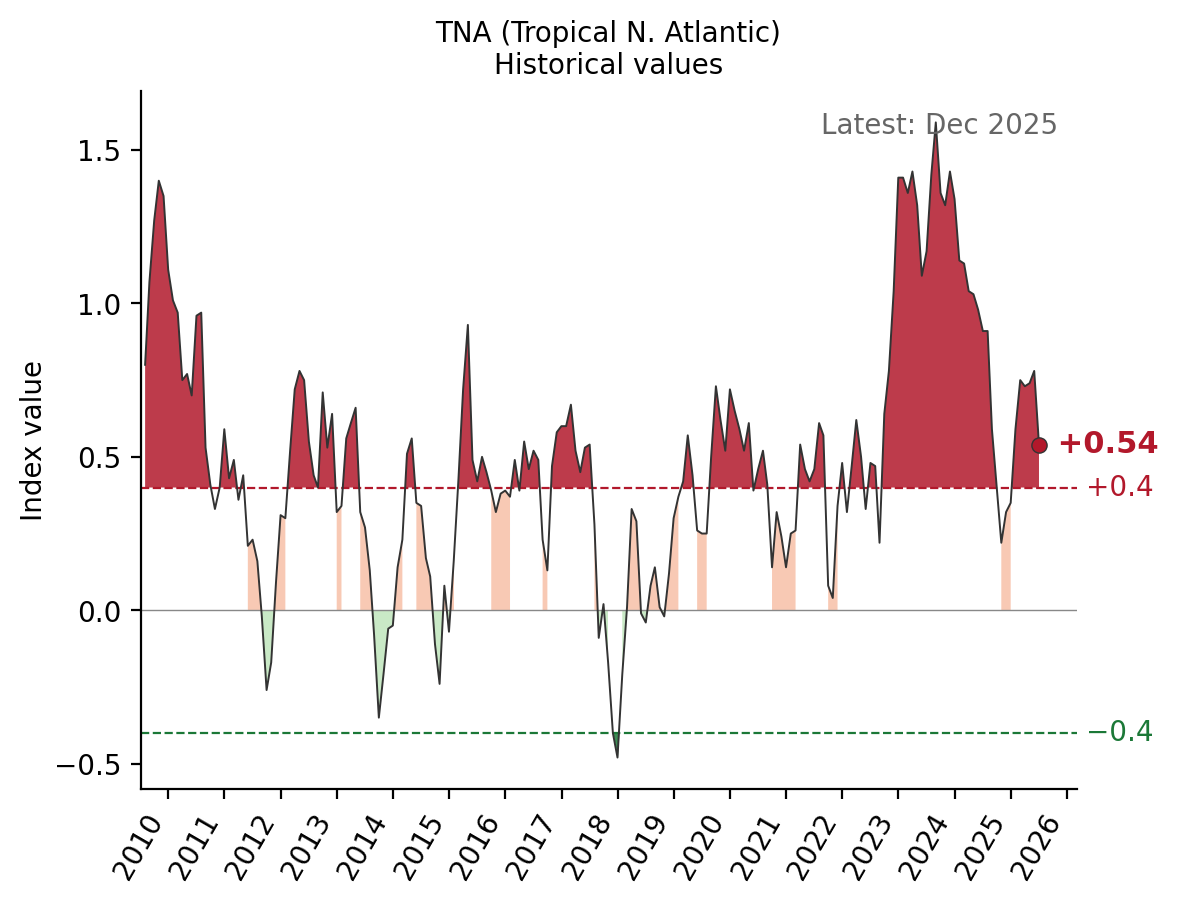
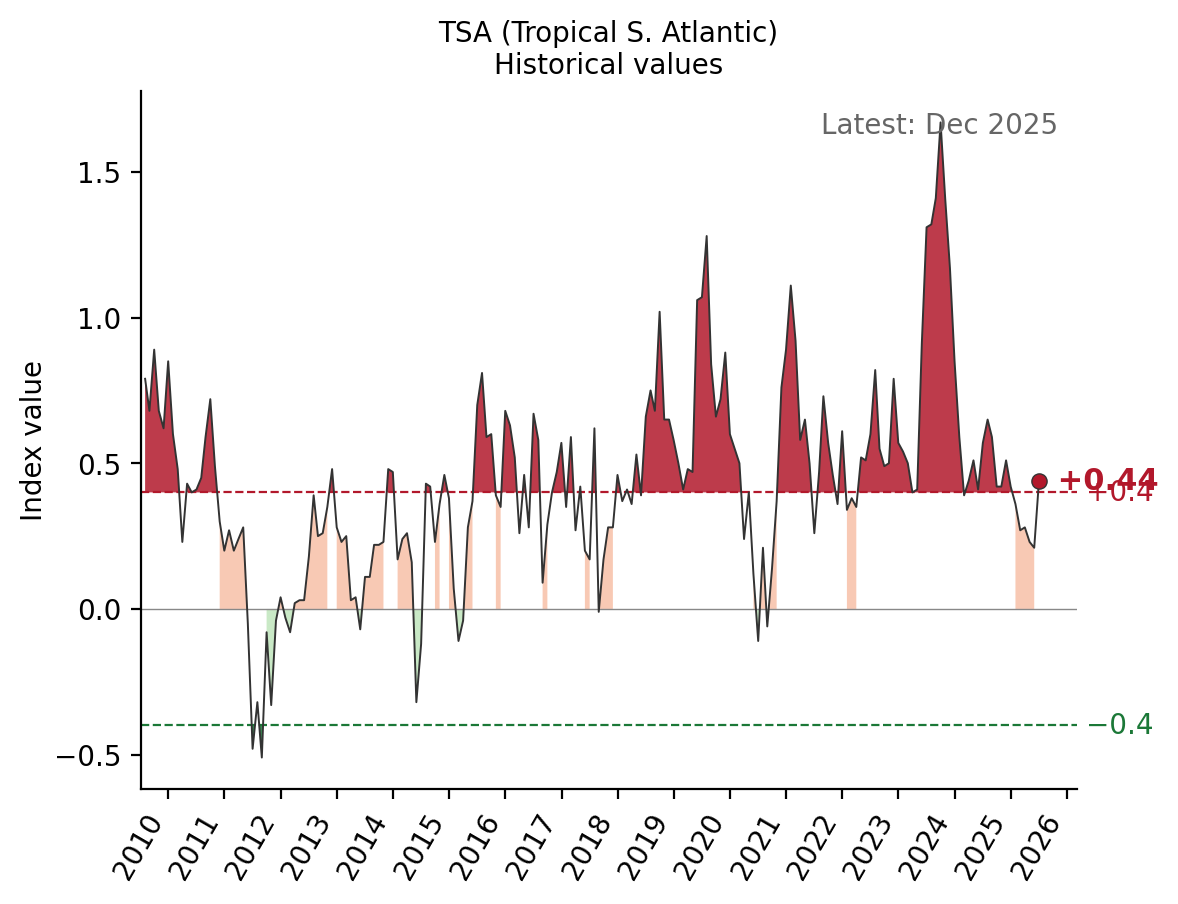
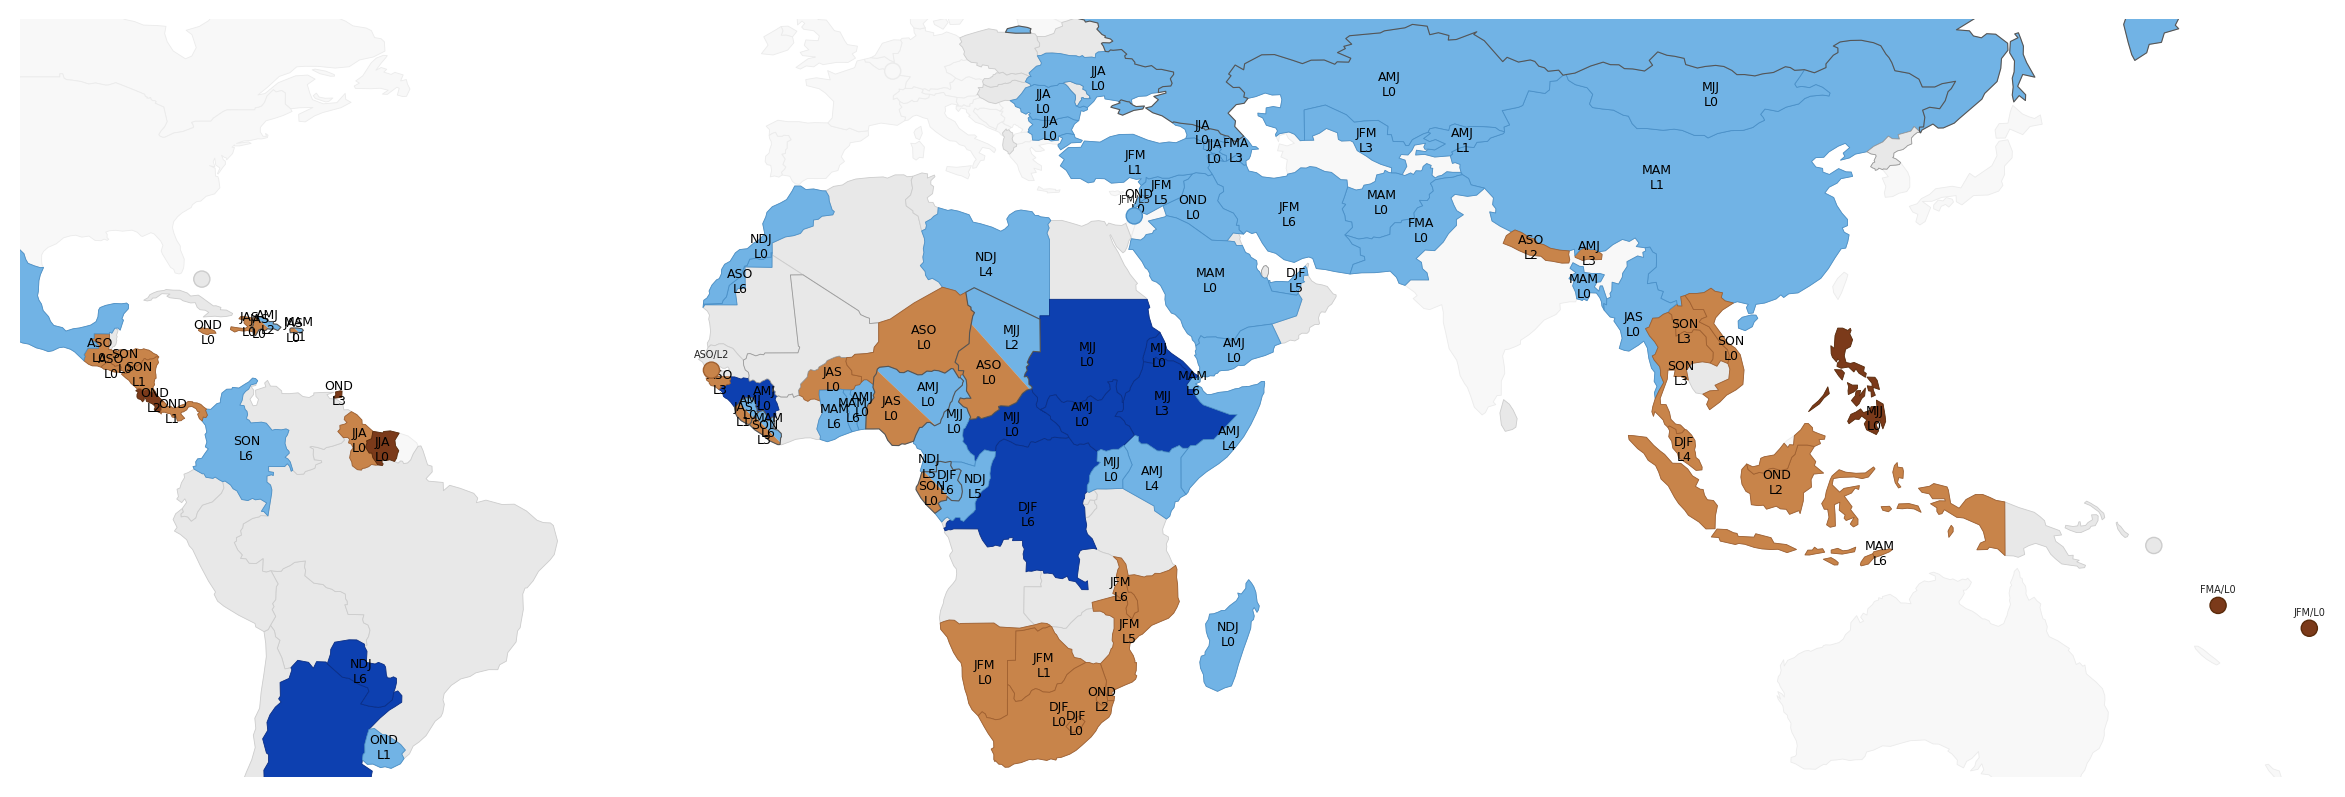
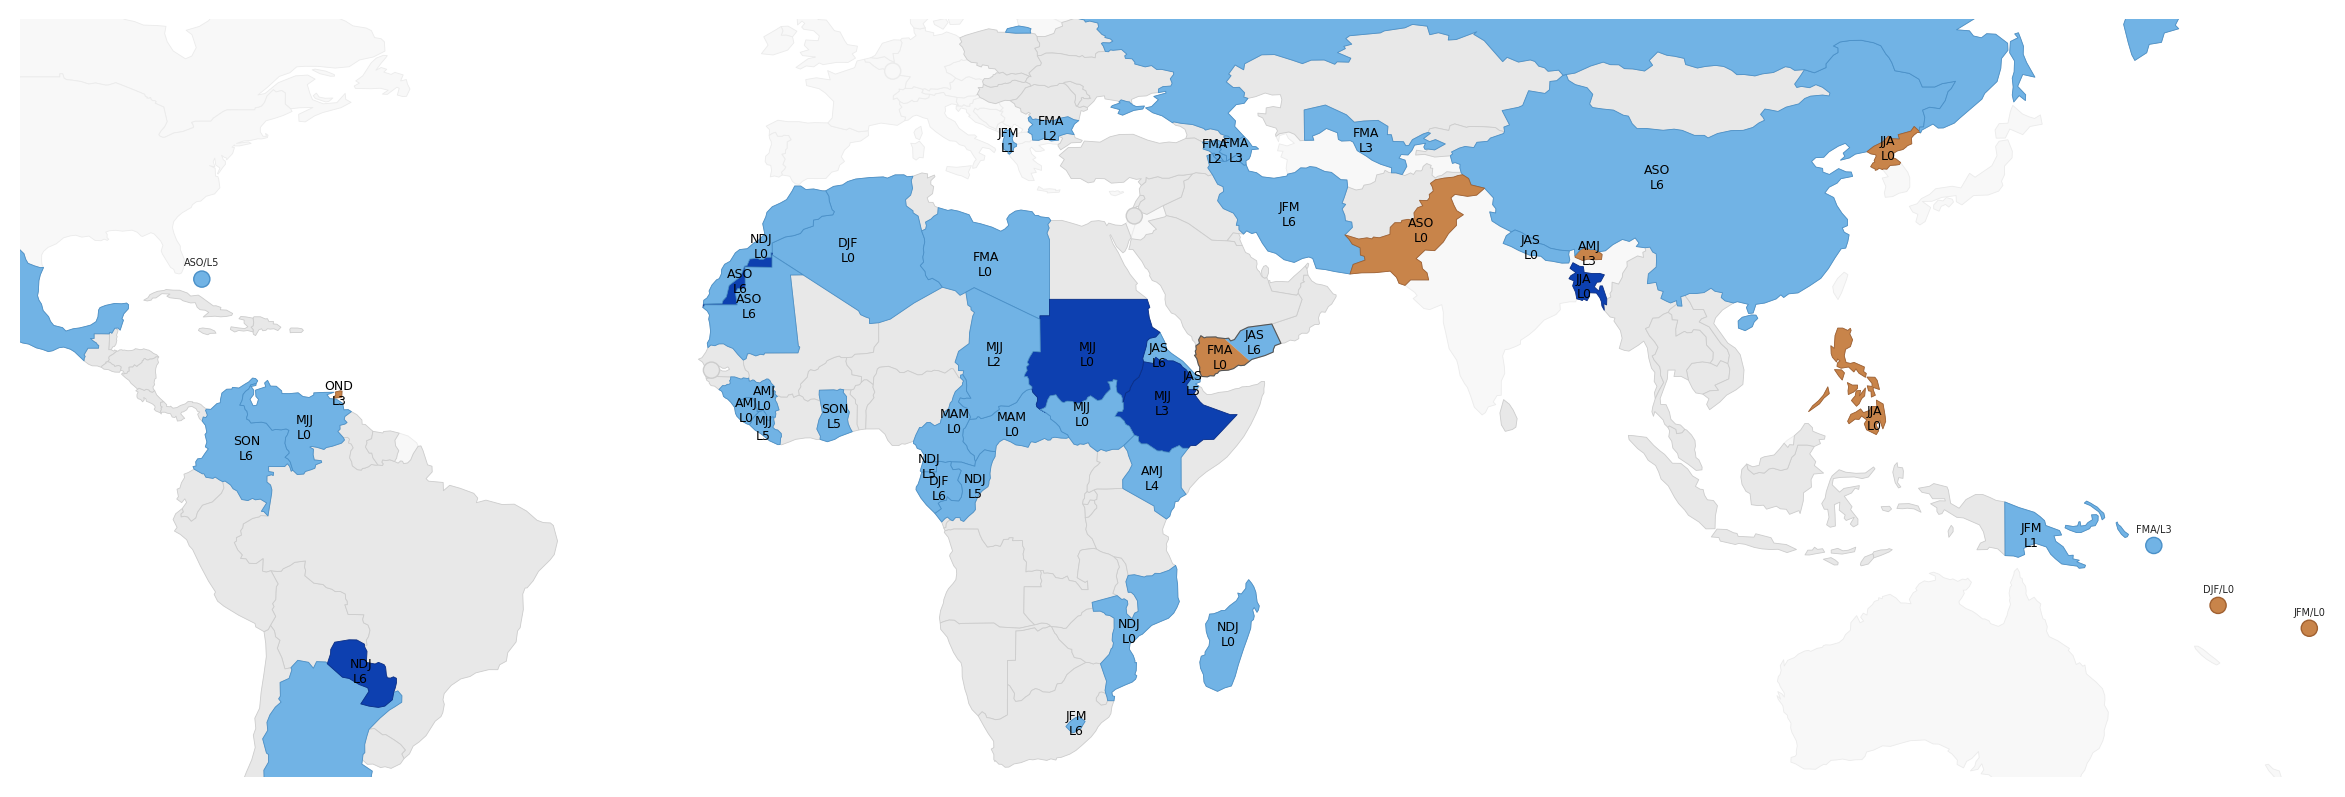
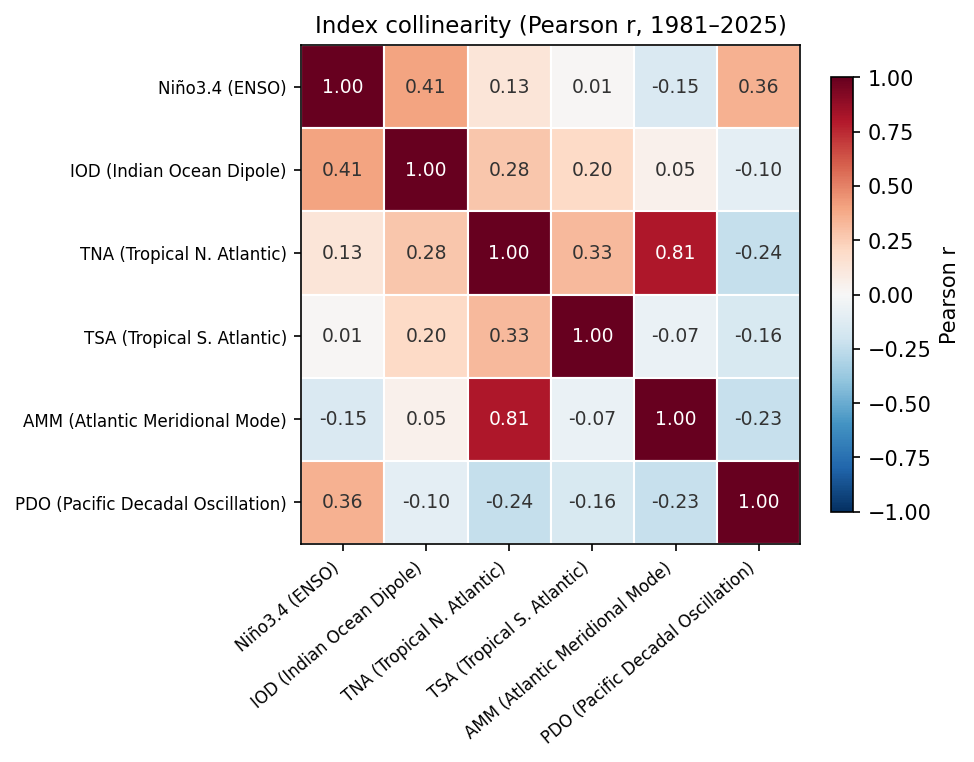
Pearson r between climate indices over the full analysis period (1981–2025). High collinearity (e.g. AMM–TNA r≈0.81) means total vs unique signal may diverge substantially for those modes — shrinkage in the unique-signal map reflects shared variance, not absent signal.
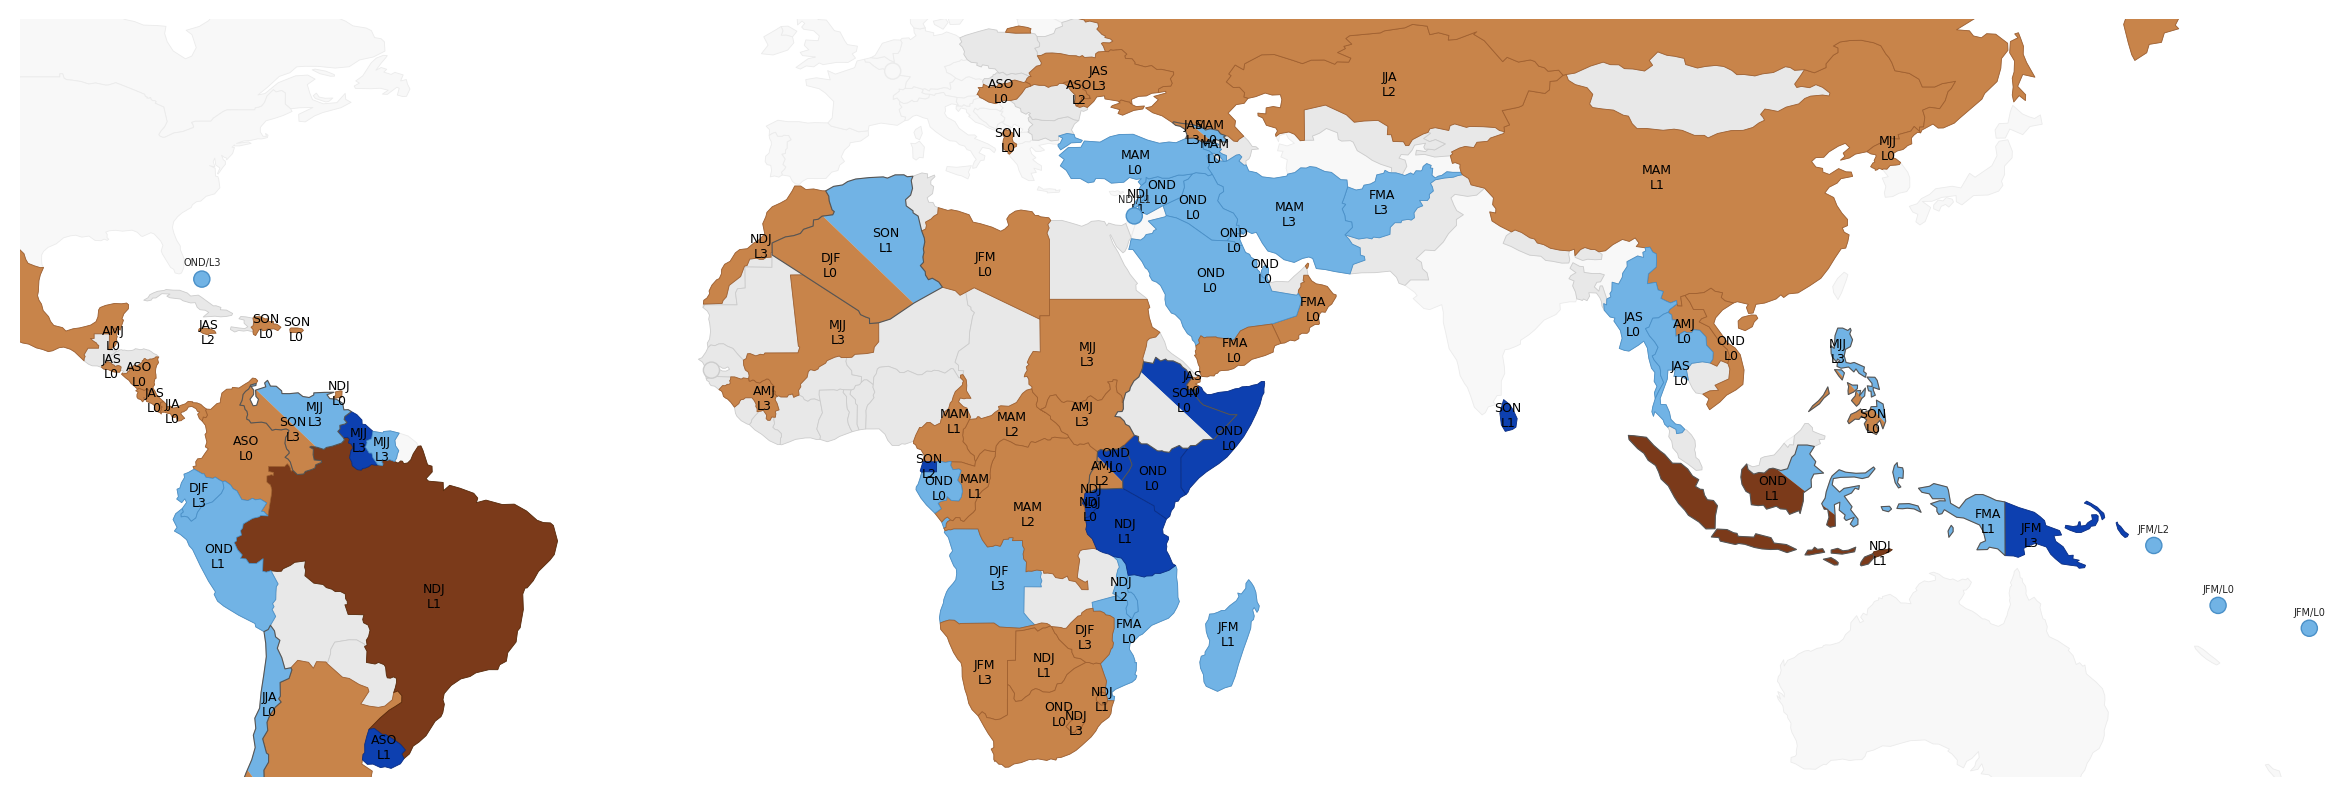
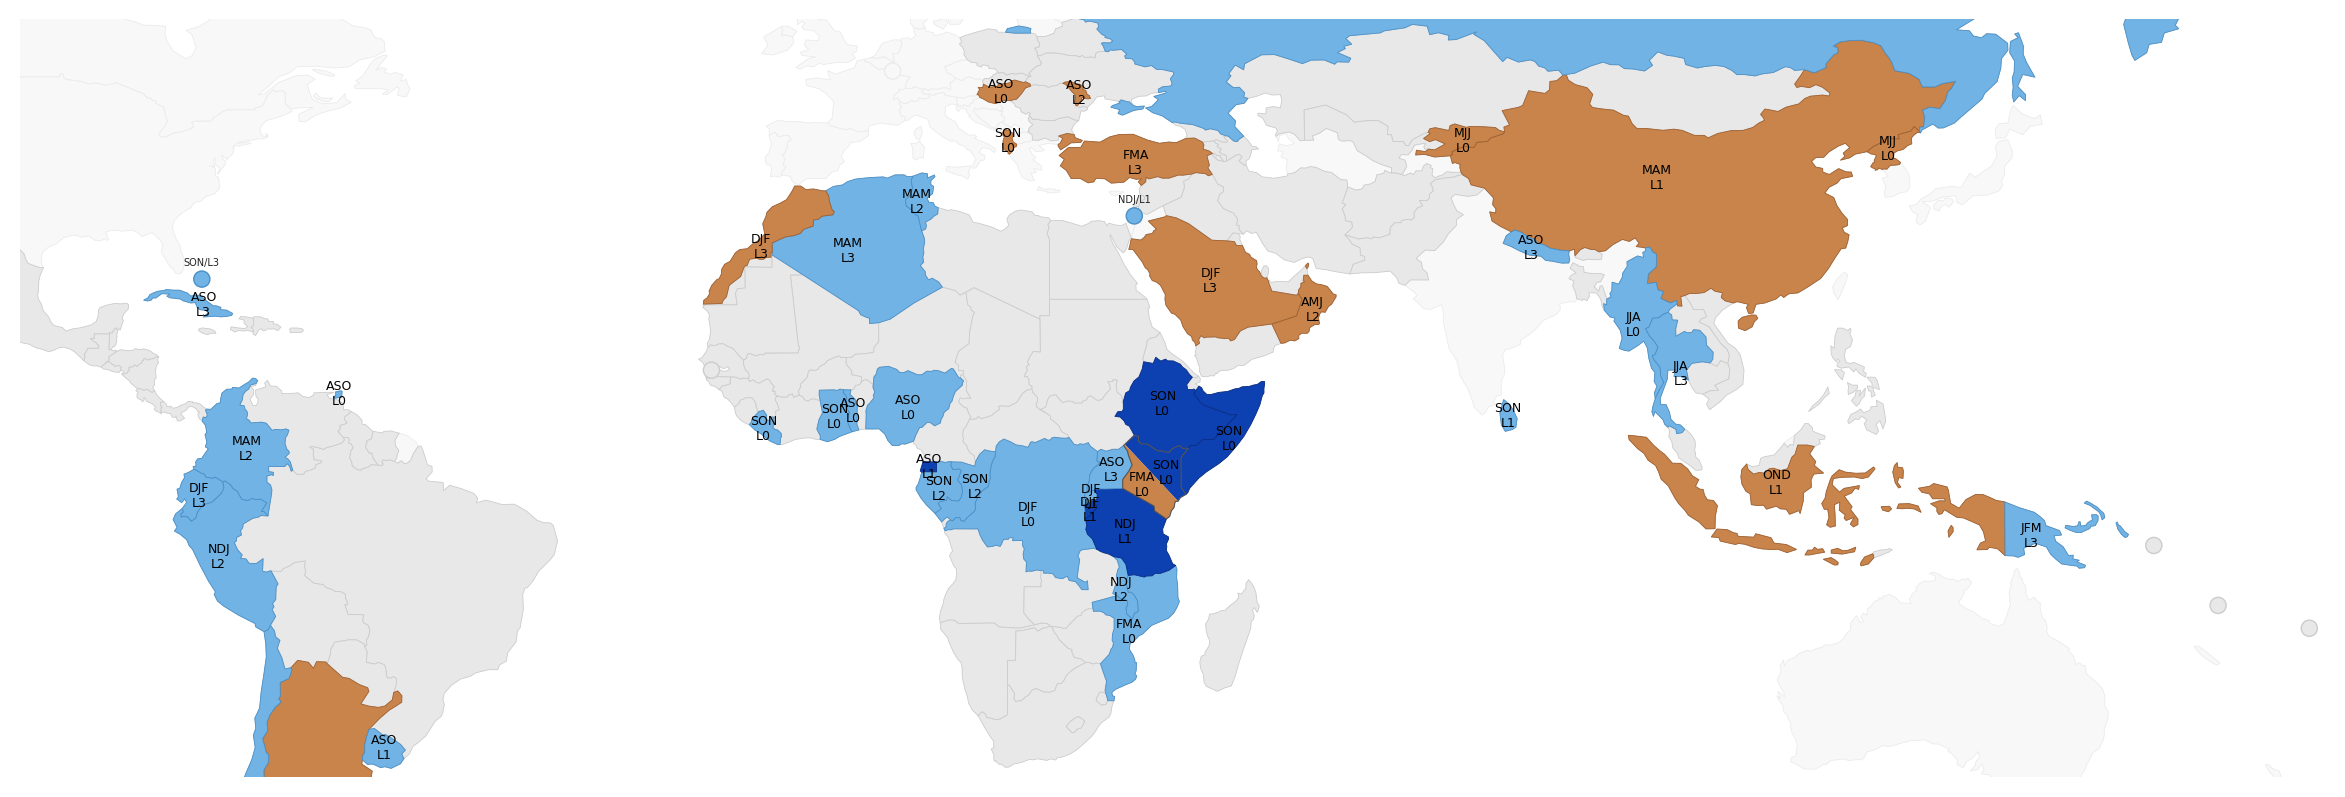
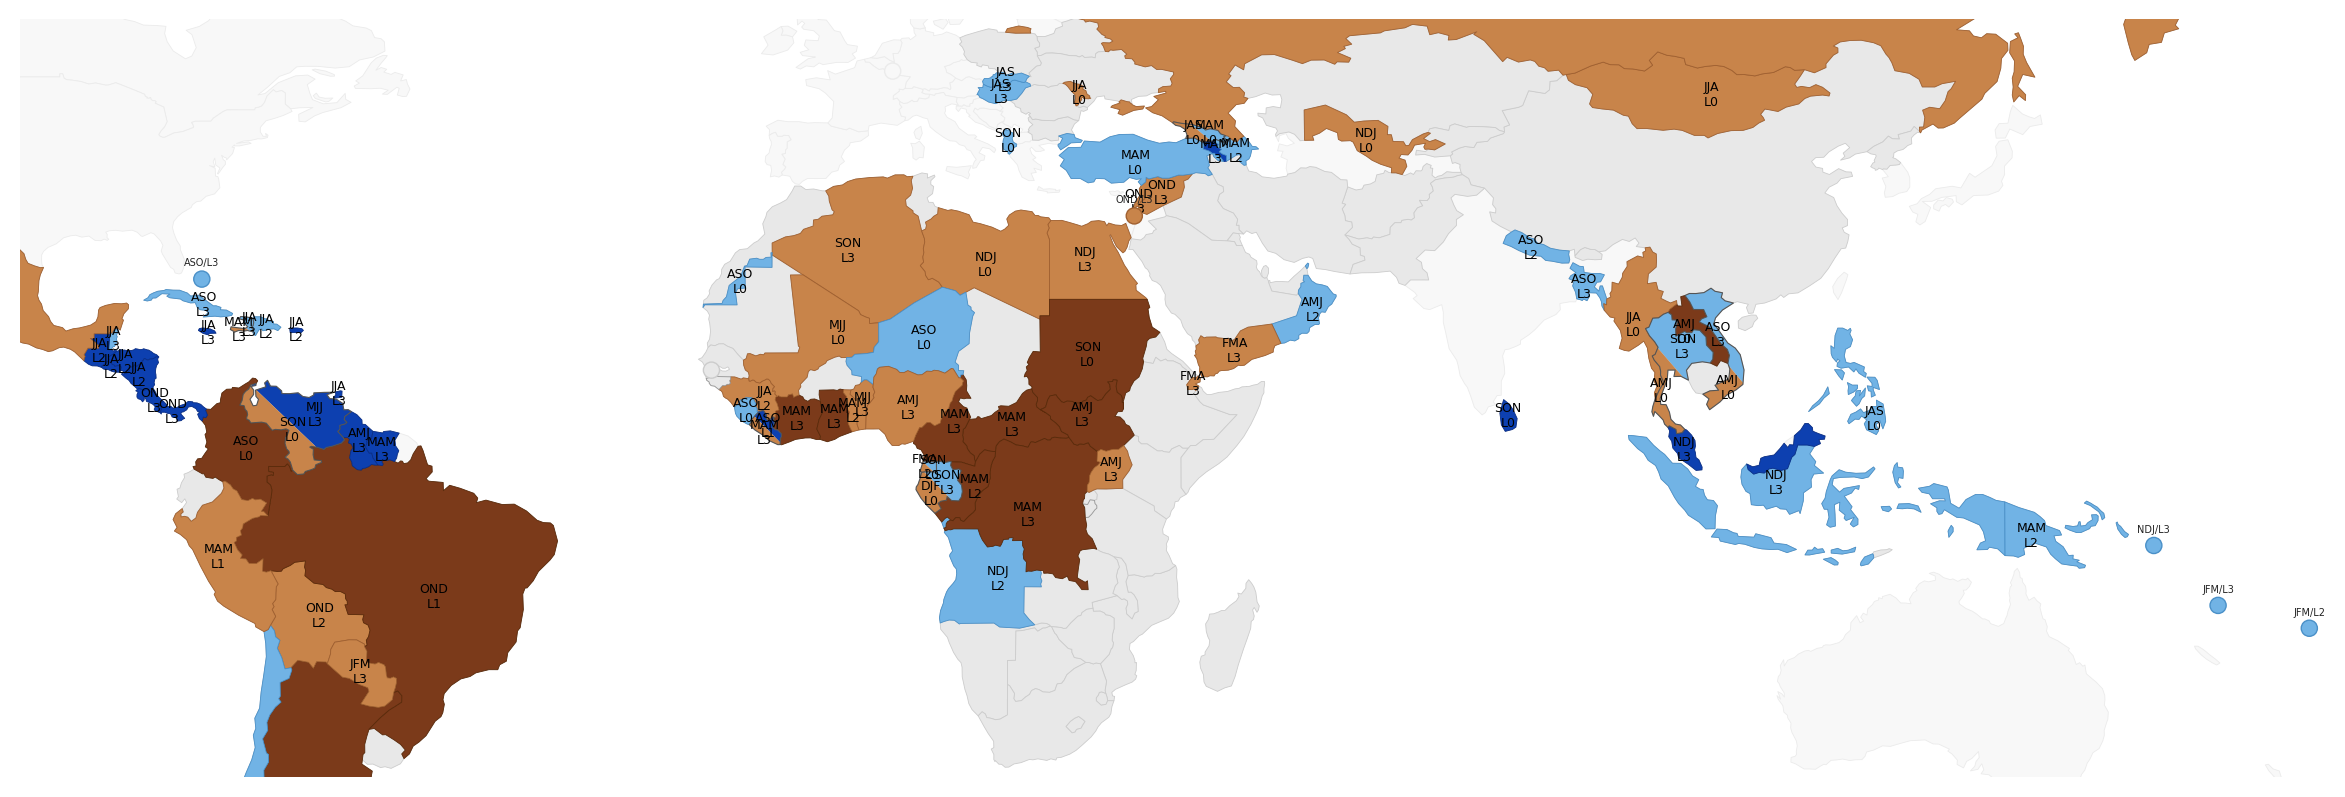
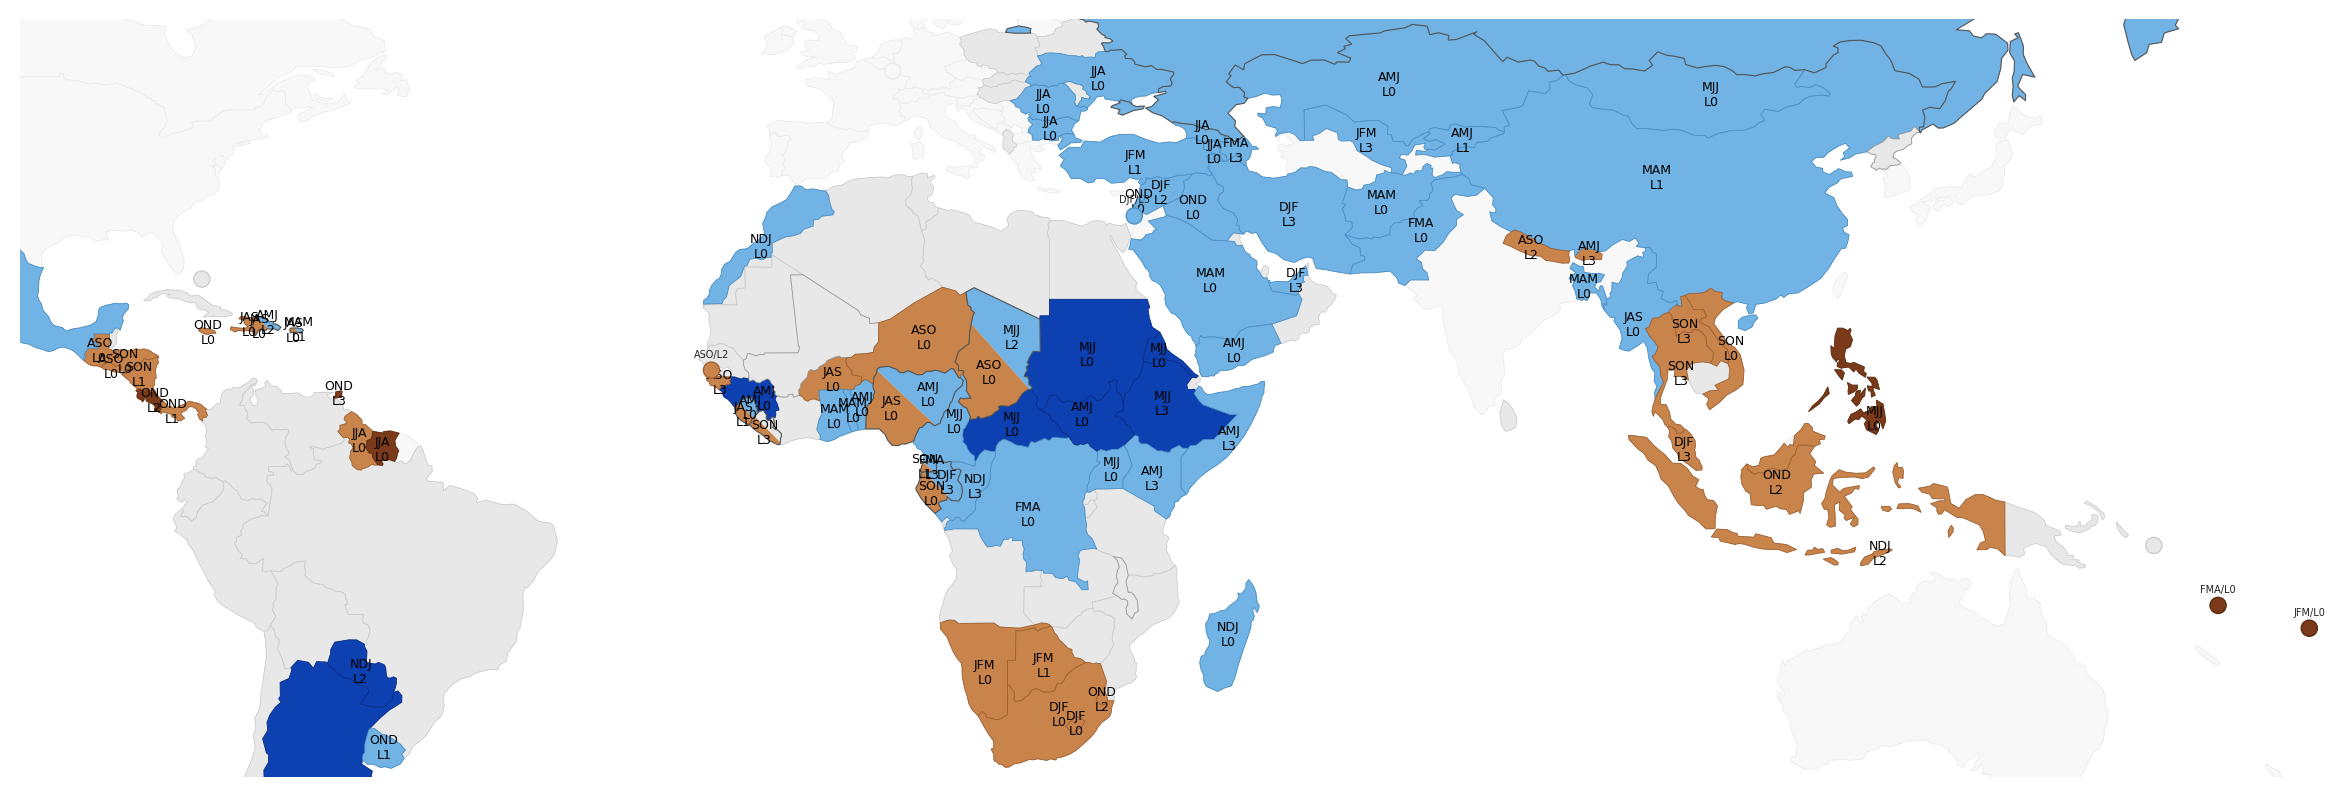
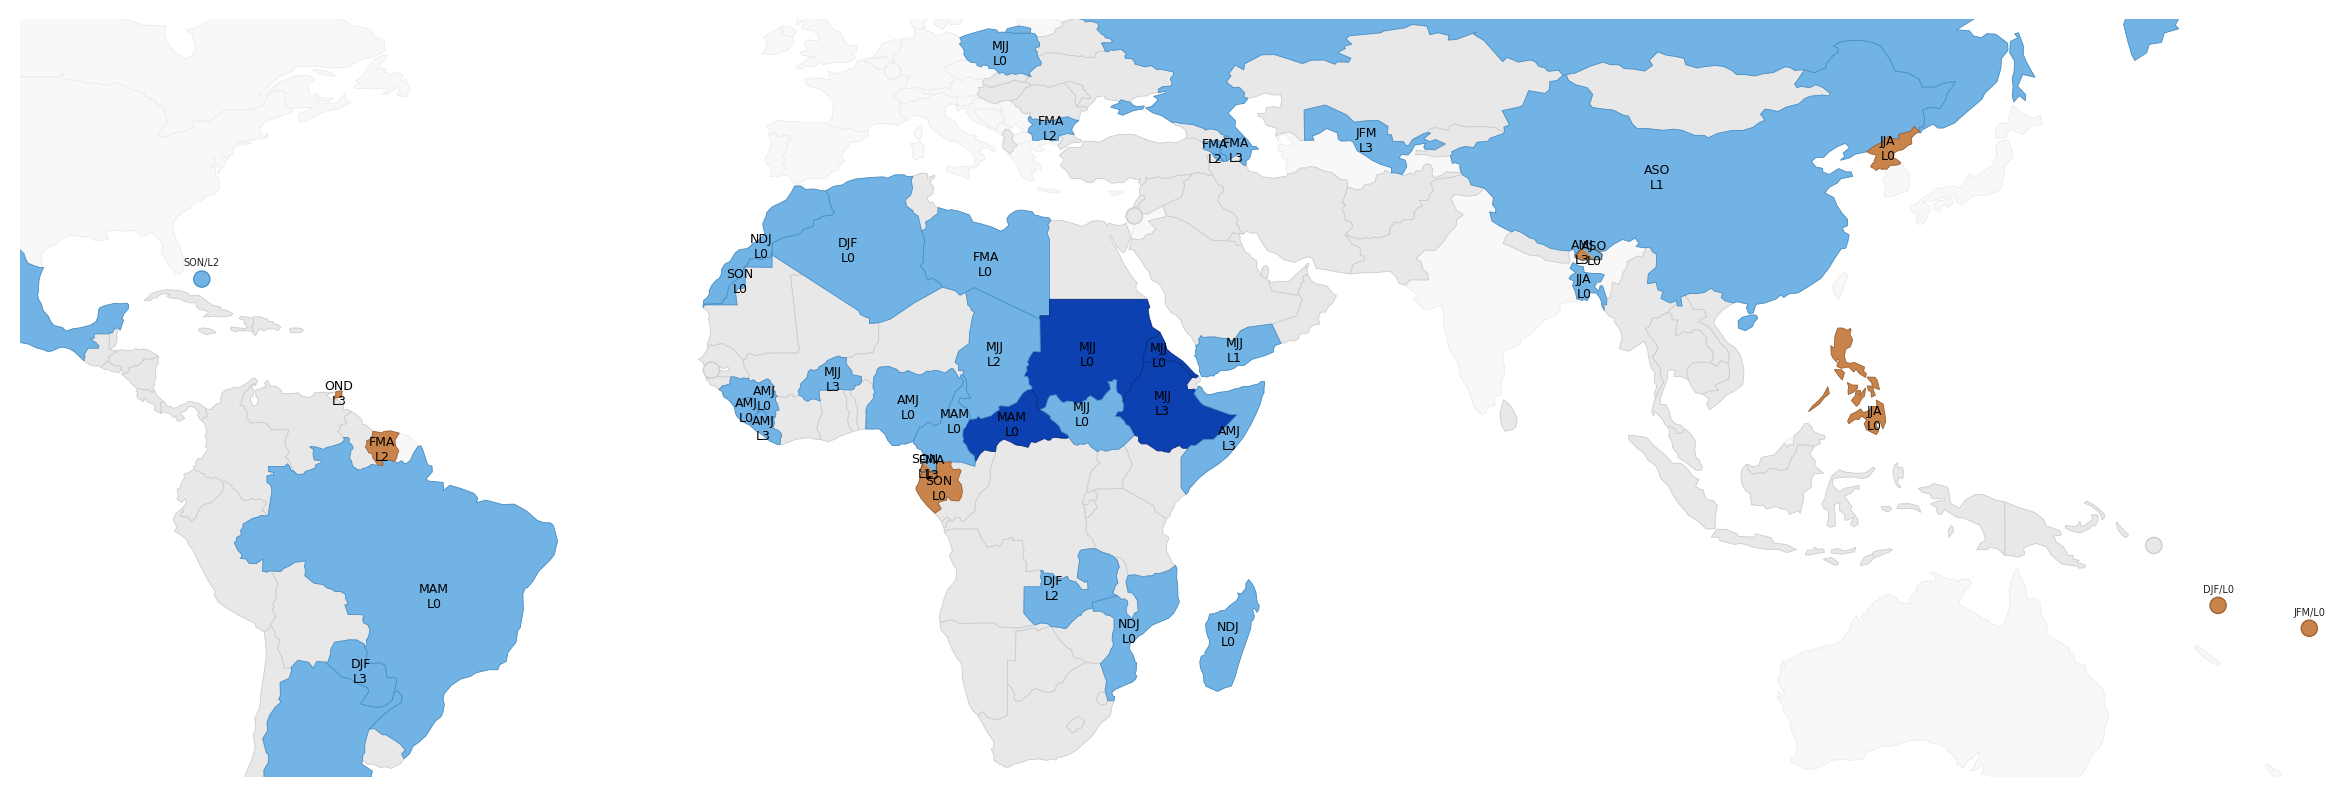
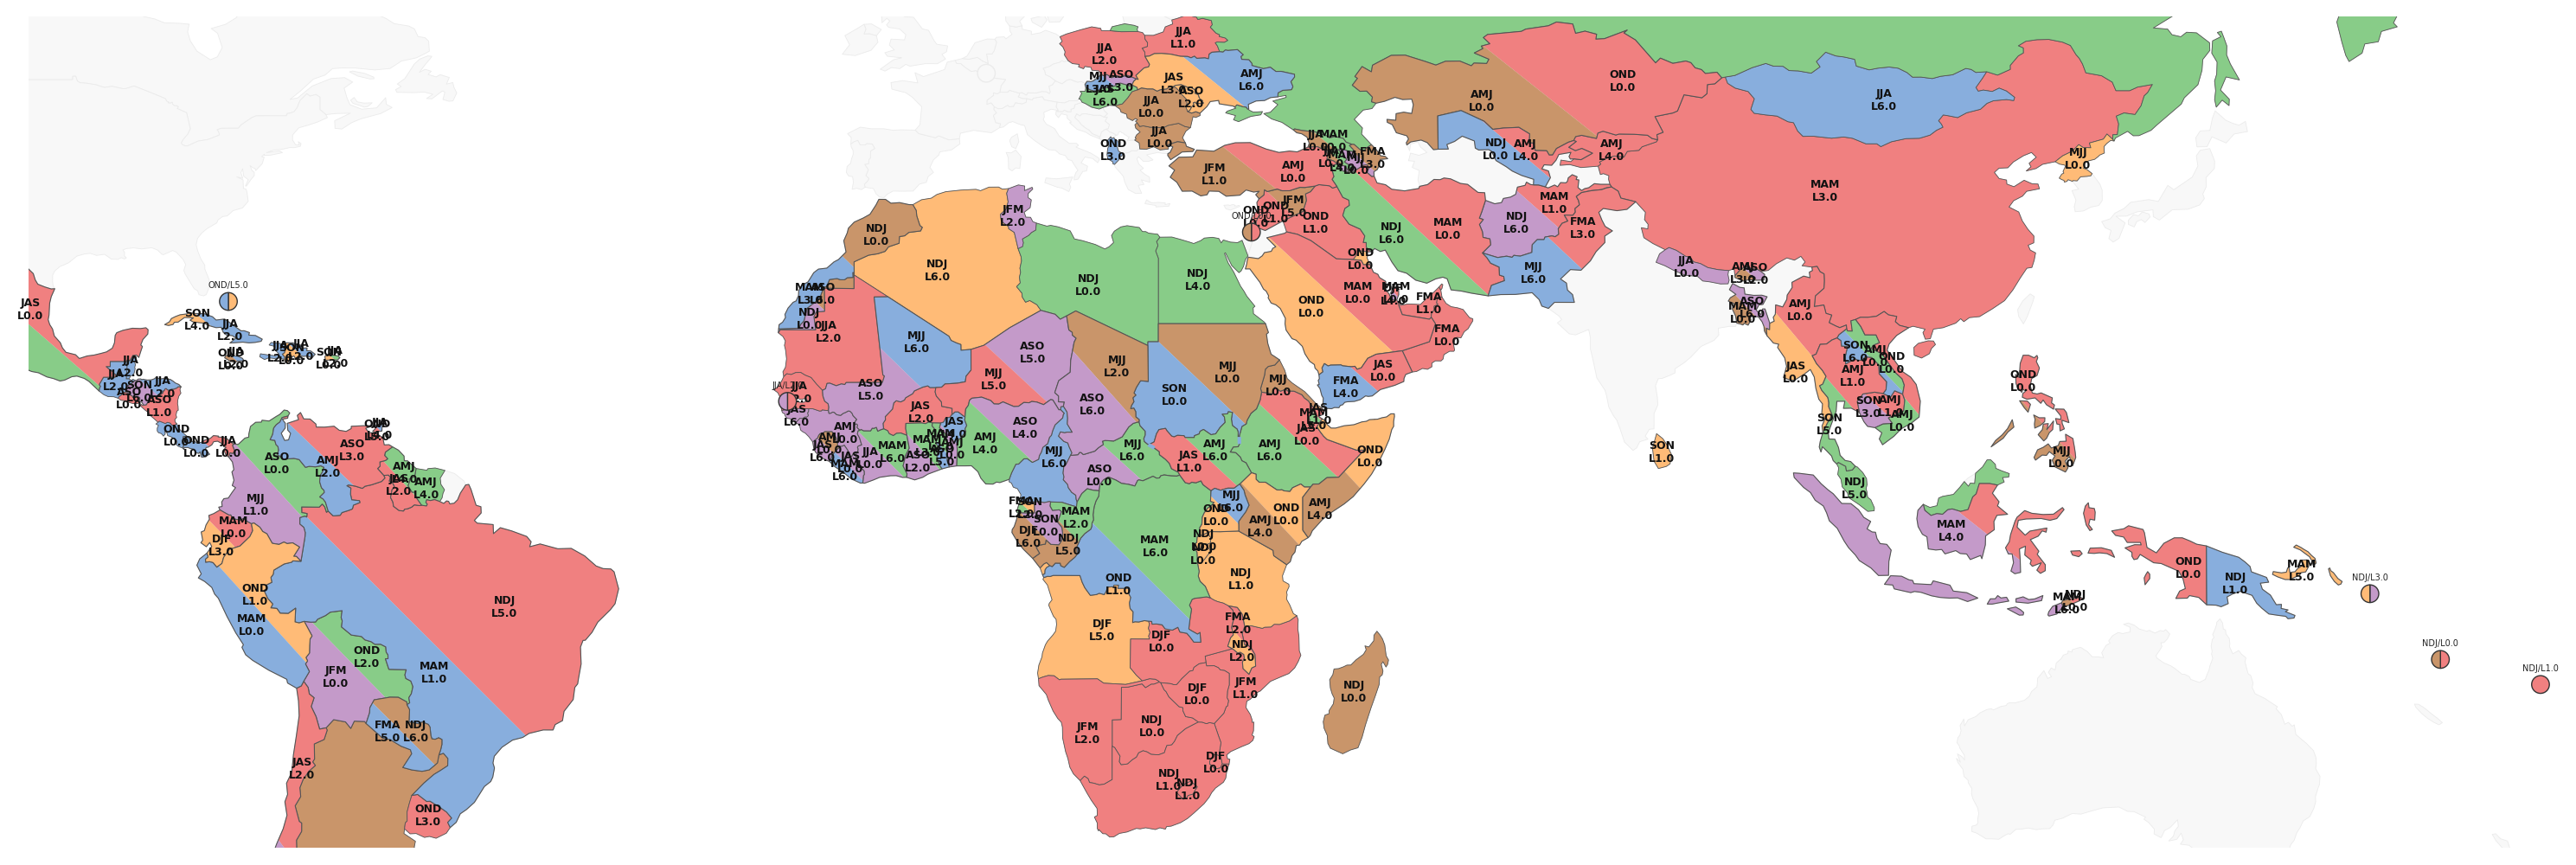
Each country colored by the index with the strongest significant total correlation (|r|≥0.3). Split diagonal = second-strongest index (different mode), shown only when it acts on a non-overlapping trimester. Respects the Max lag toggle above.
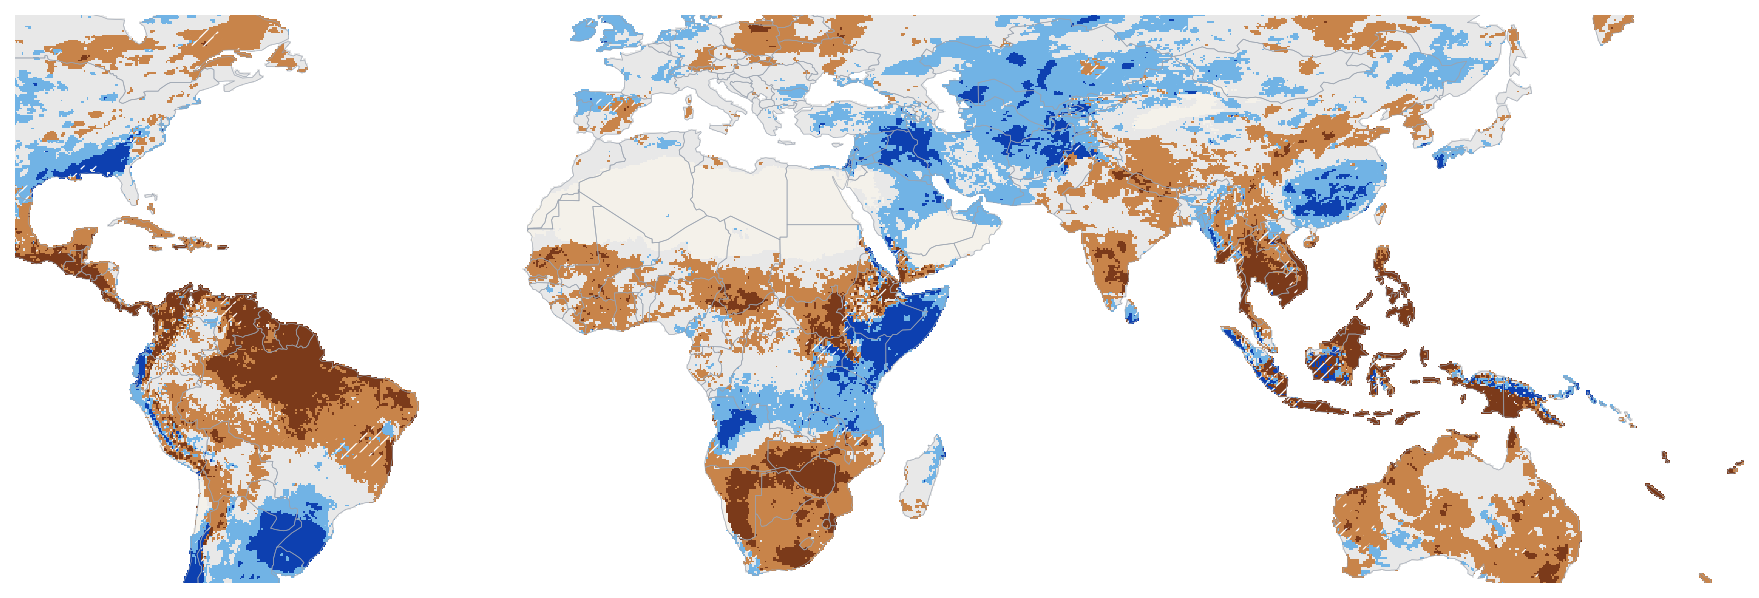
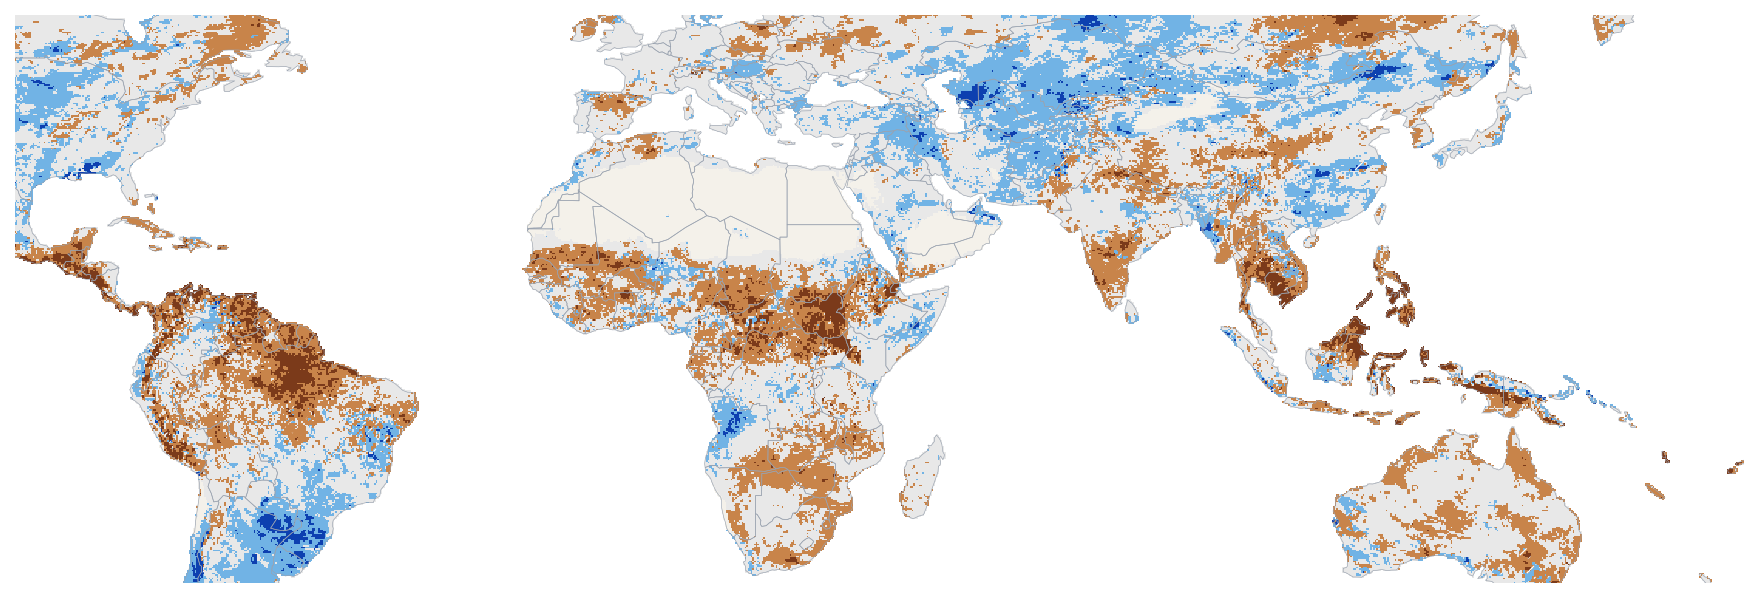
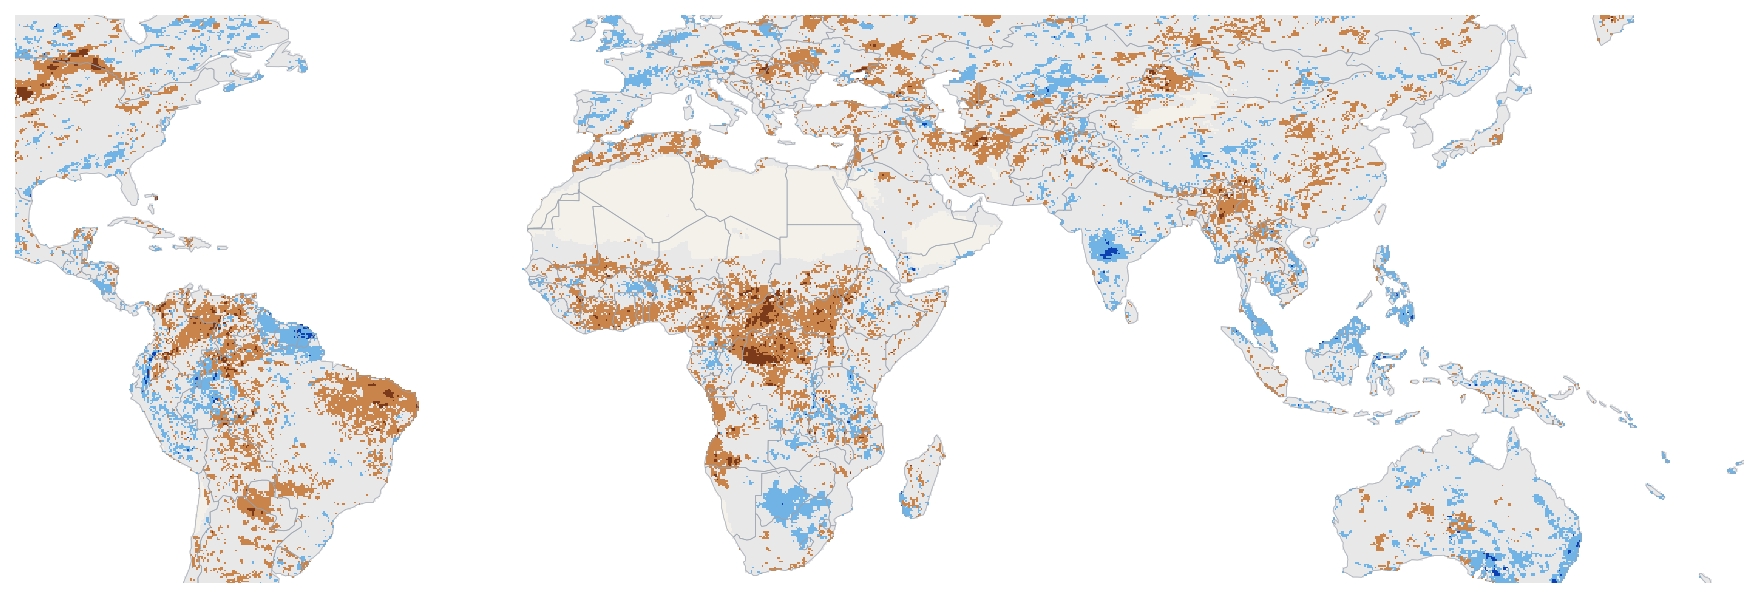
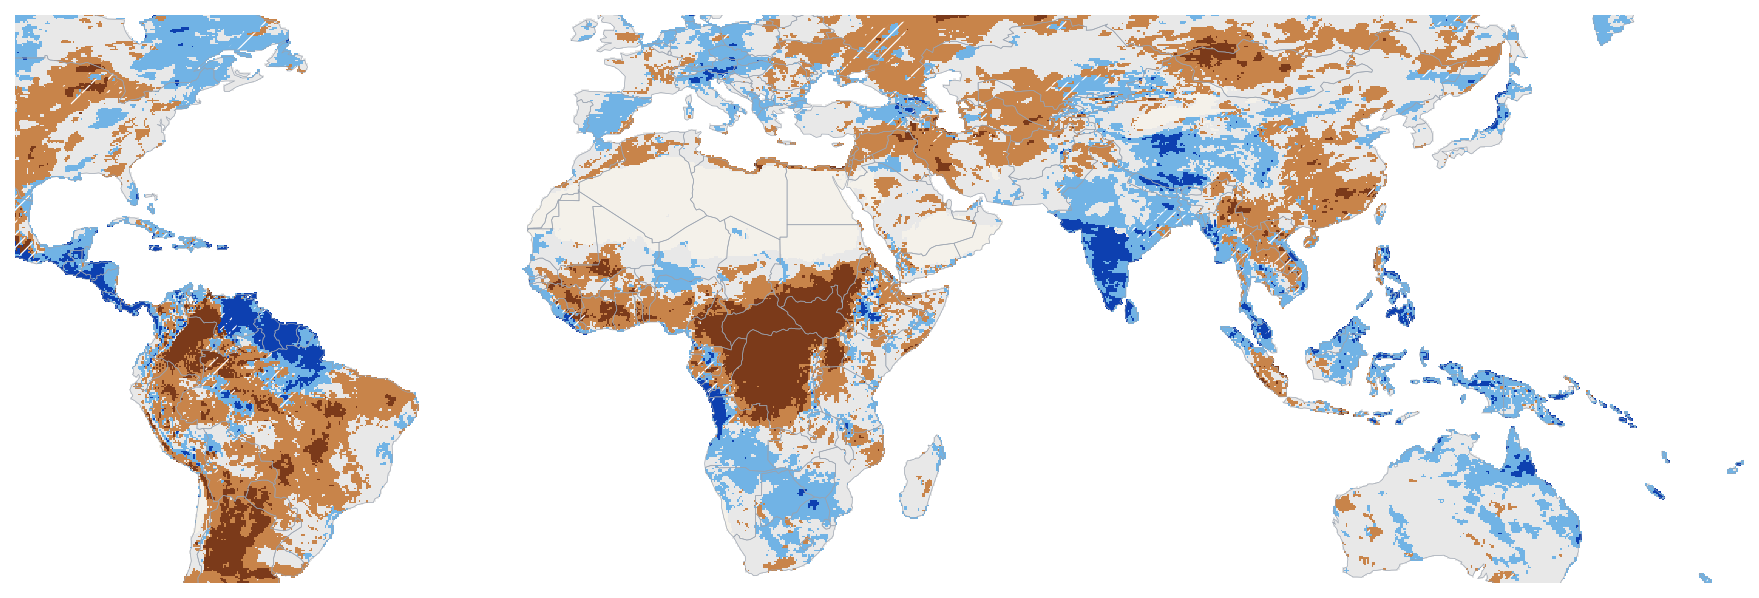
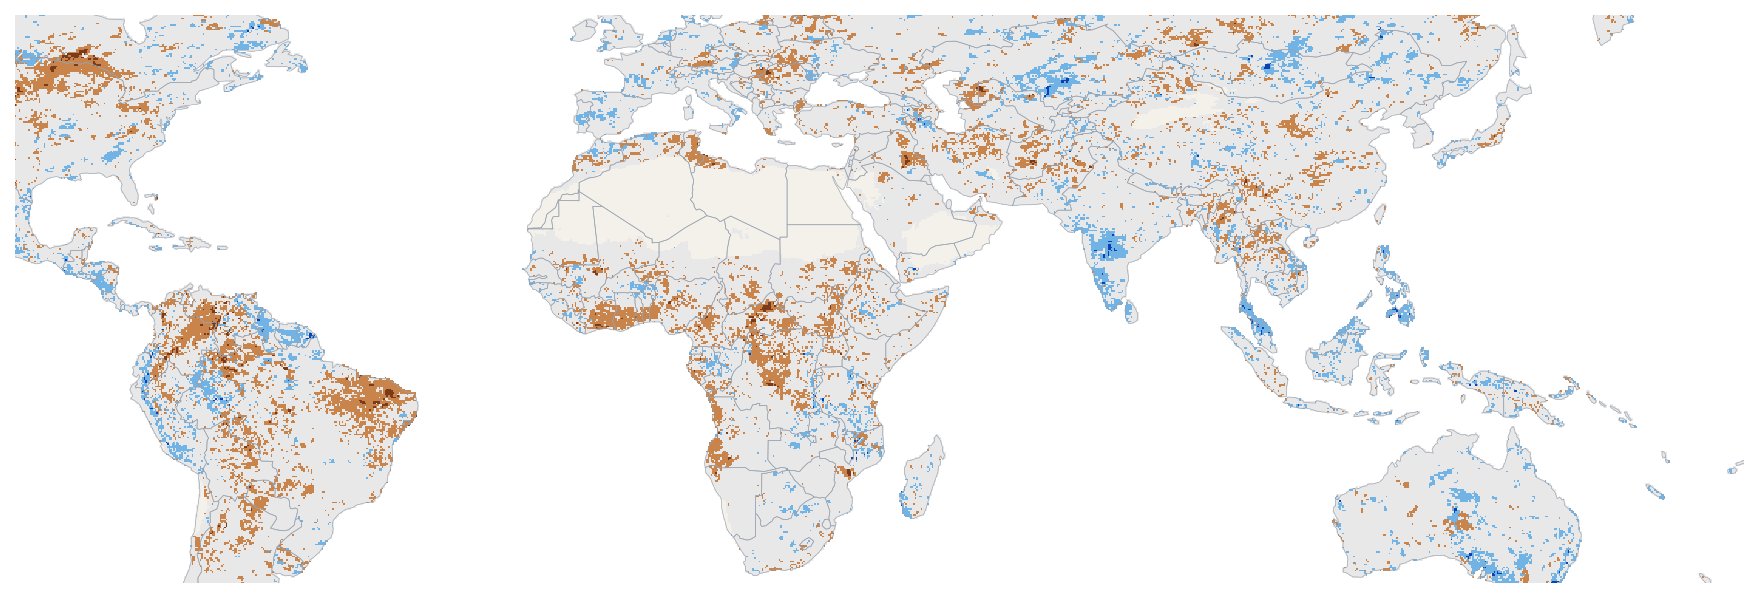
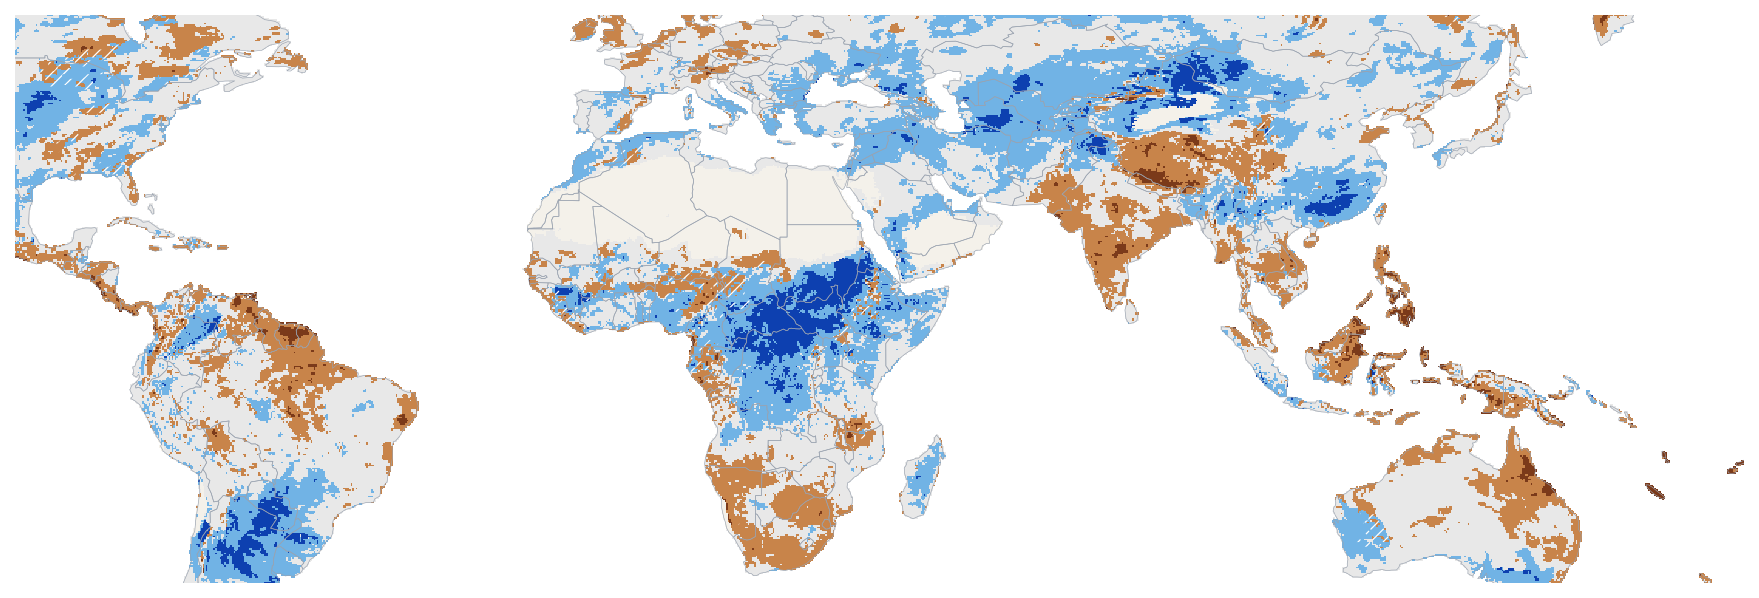
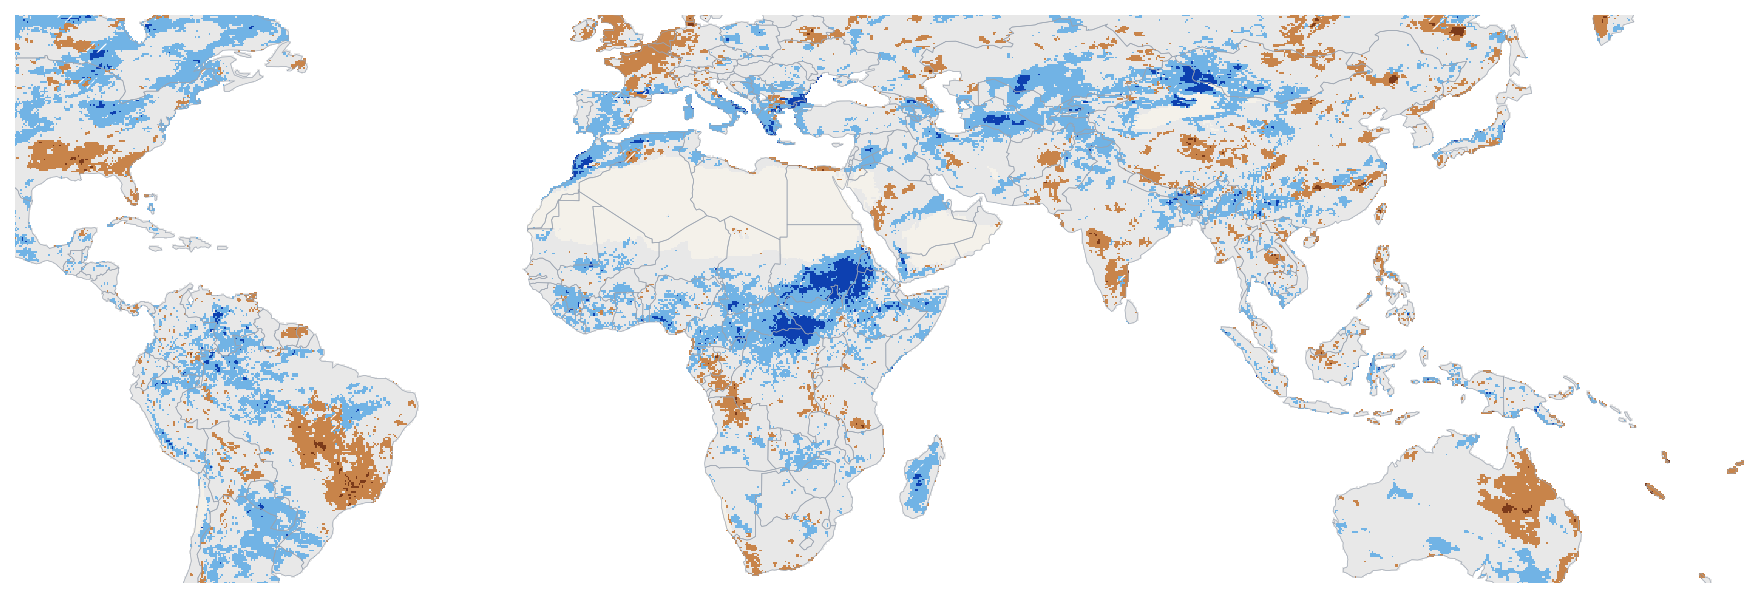
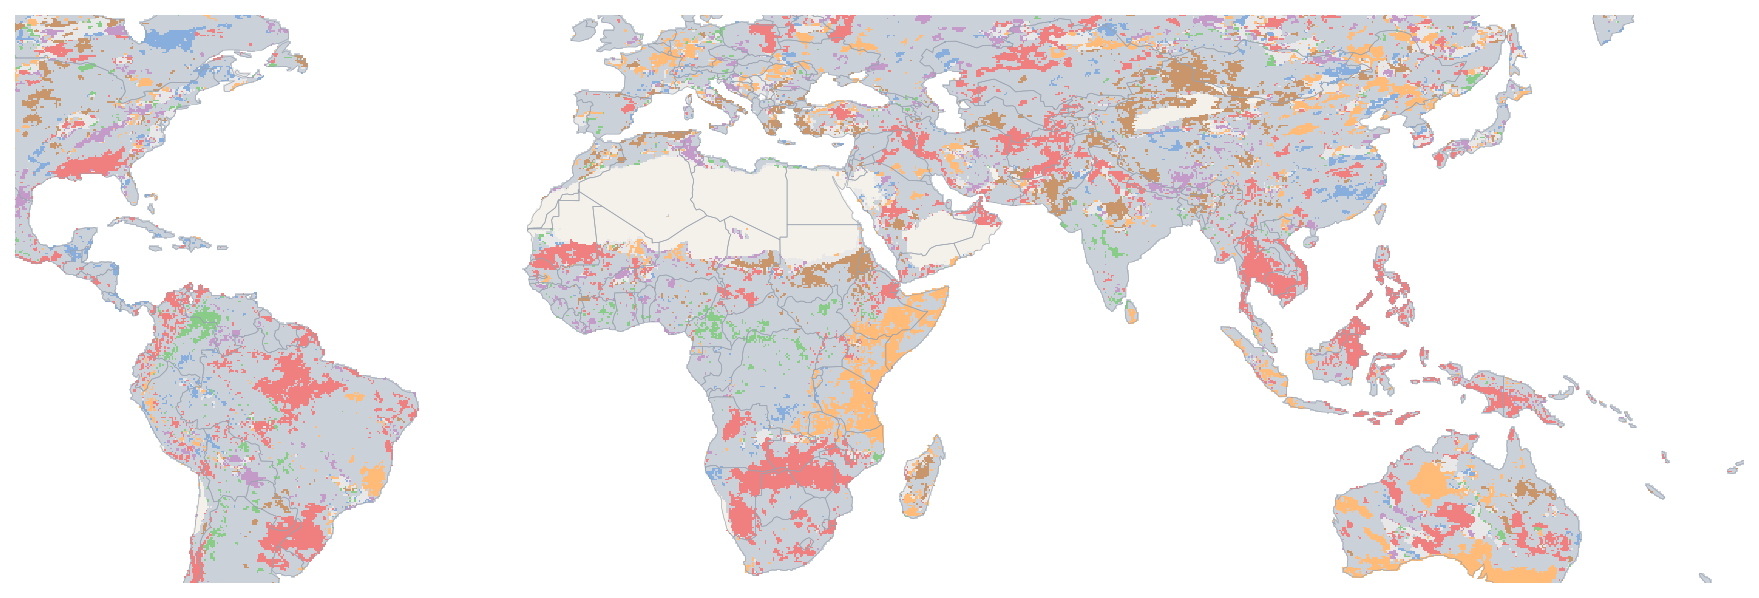
Each 0.25° land cell colored by the index with the strongest significant total correlation (|r|≥0.3), where that mode leads the runner-up by at least 0.10. Respects the Max lag toggle above.


Top mode only — the runner-up mode shown as a split diagonal on the country map is not legible at 0.25°. A cell is coloured only where the leading mode's |r| exceeds the runner-up's by at least 0.10; a single grid cell does not average enough area to make the arg-max over six collinear modes stable, so cells where the top two are within noise of each other are left grey rather than assigned to an arbitrary winner.

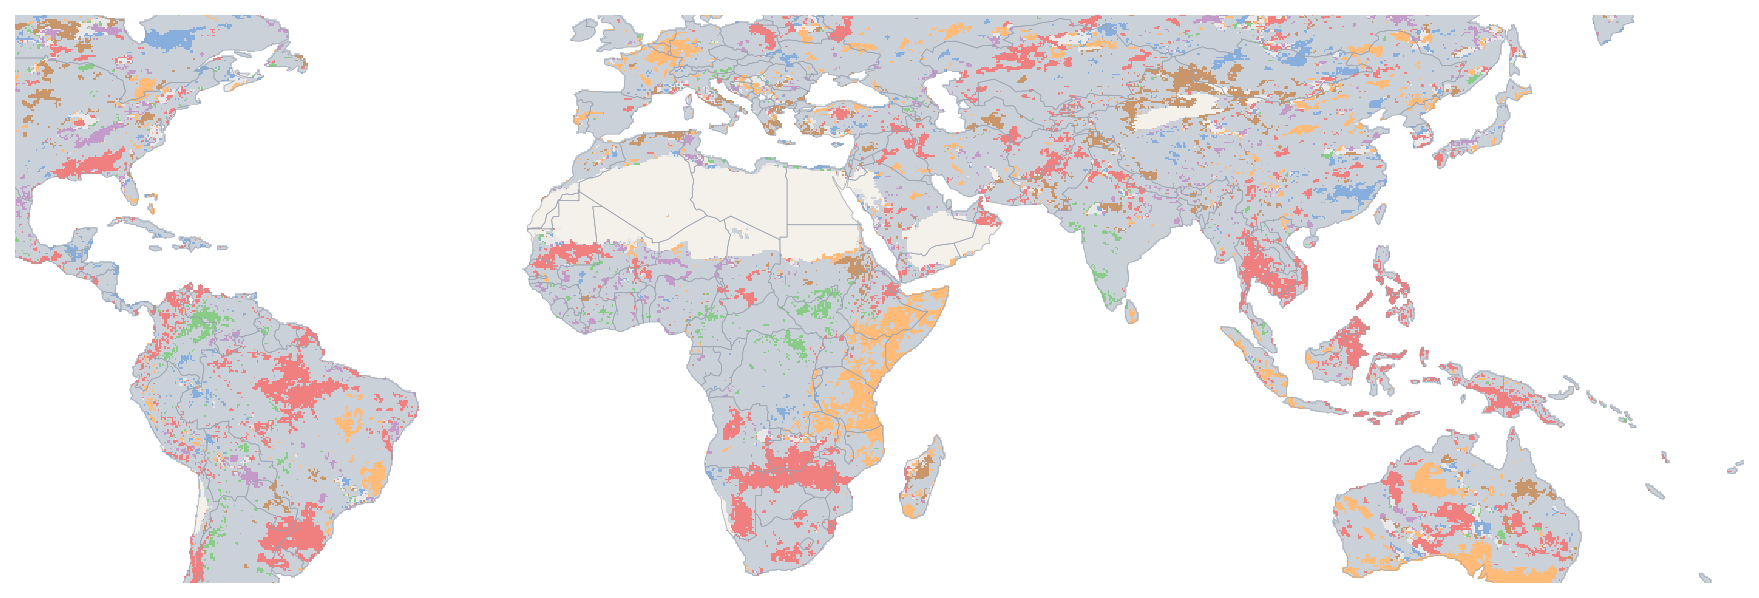
Top mode only — the runner-up mode shown as a split diagonal on the country map is not legible at 0.25°. A cell is coloured only where the leading mode's |r| exceeds the runner-up's by at least 0.10; a single grid cell does not average enough area to make the arg-max over six collinear modes stable, so cells where the top two are within noise of each other are left grey rather than assigned to an arbitrary winner.
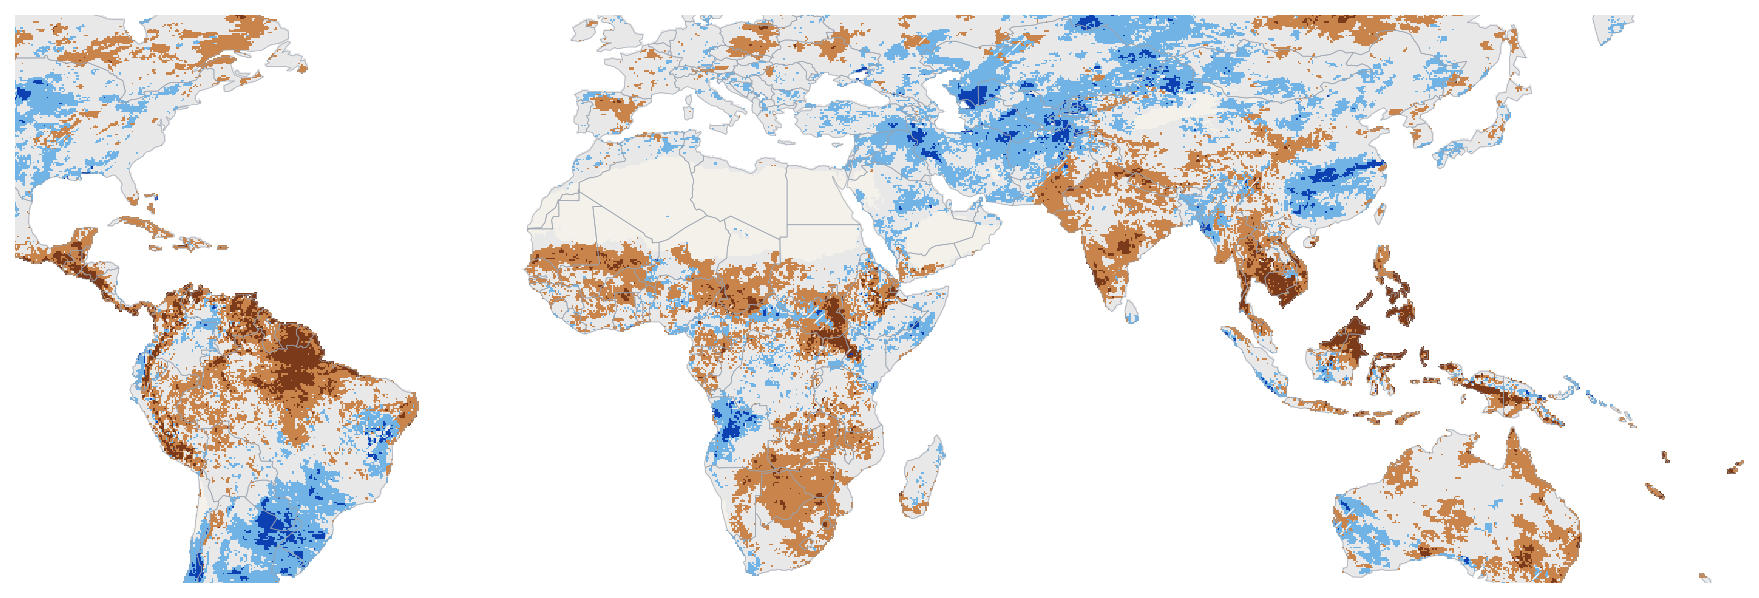
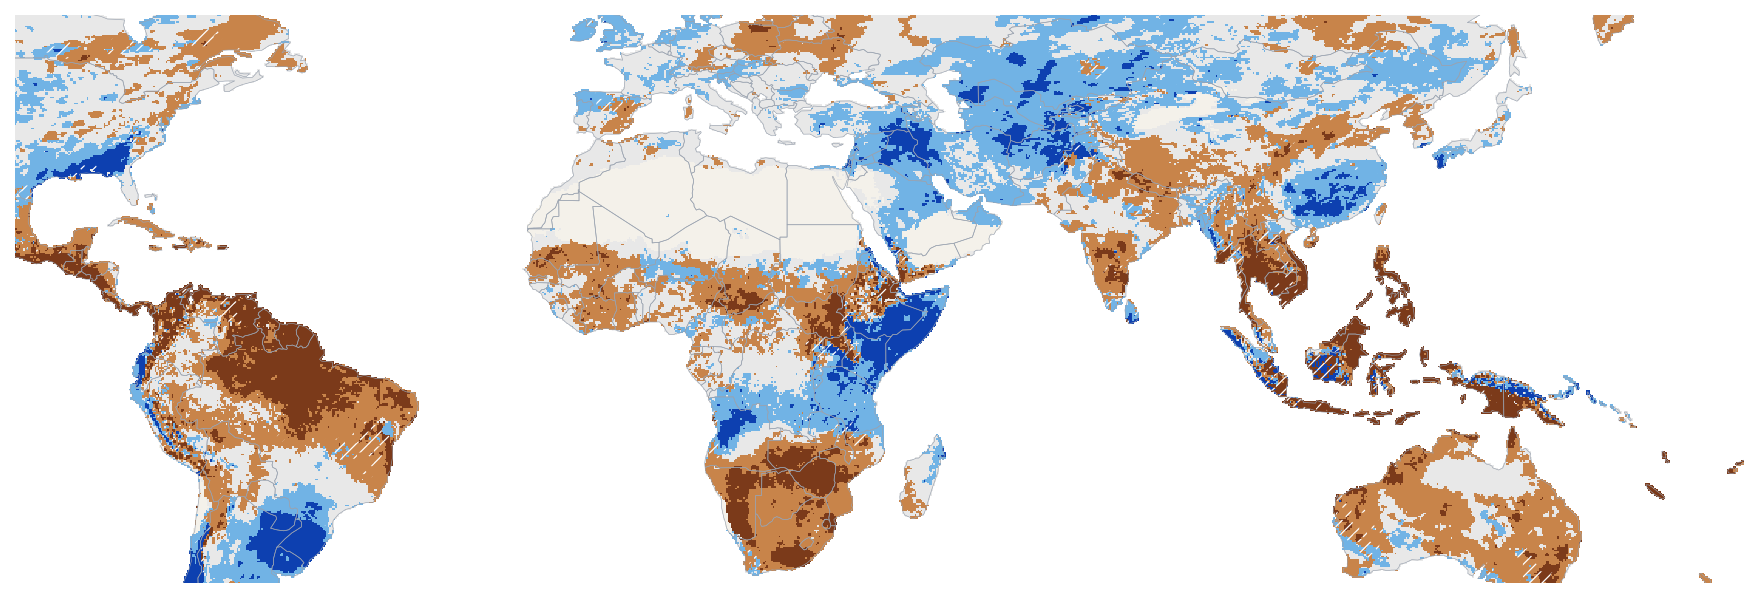
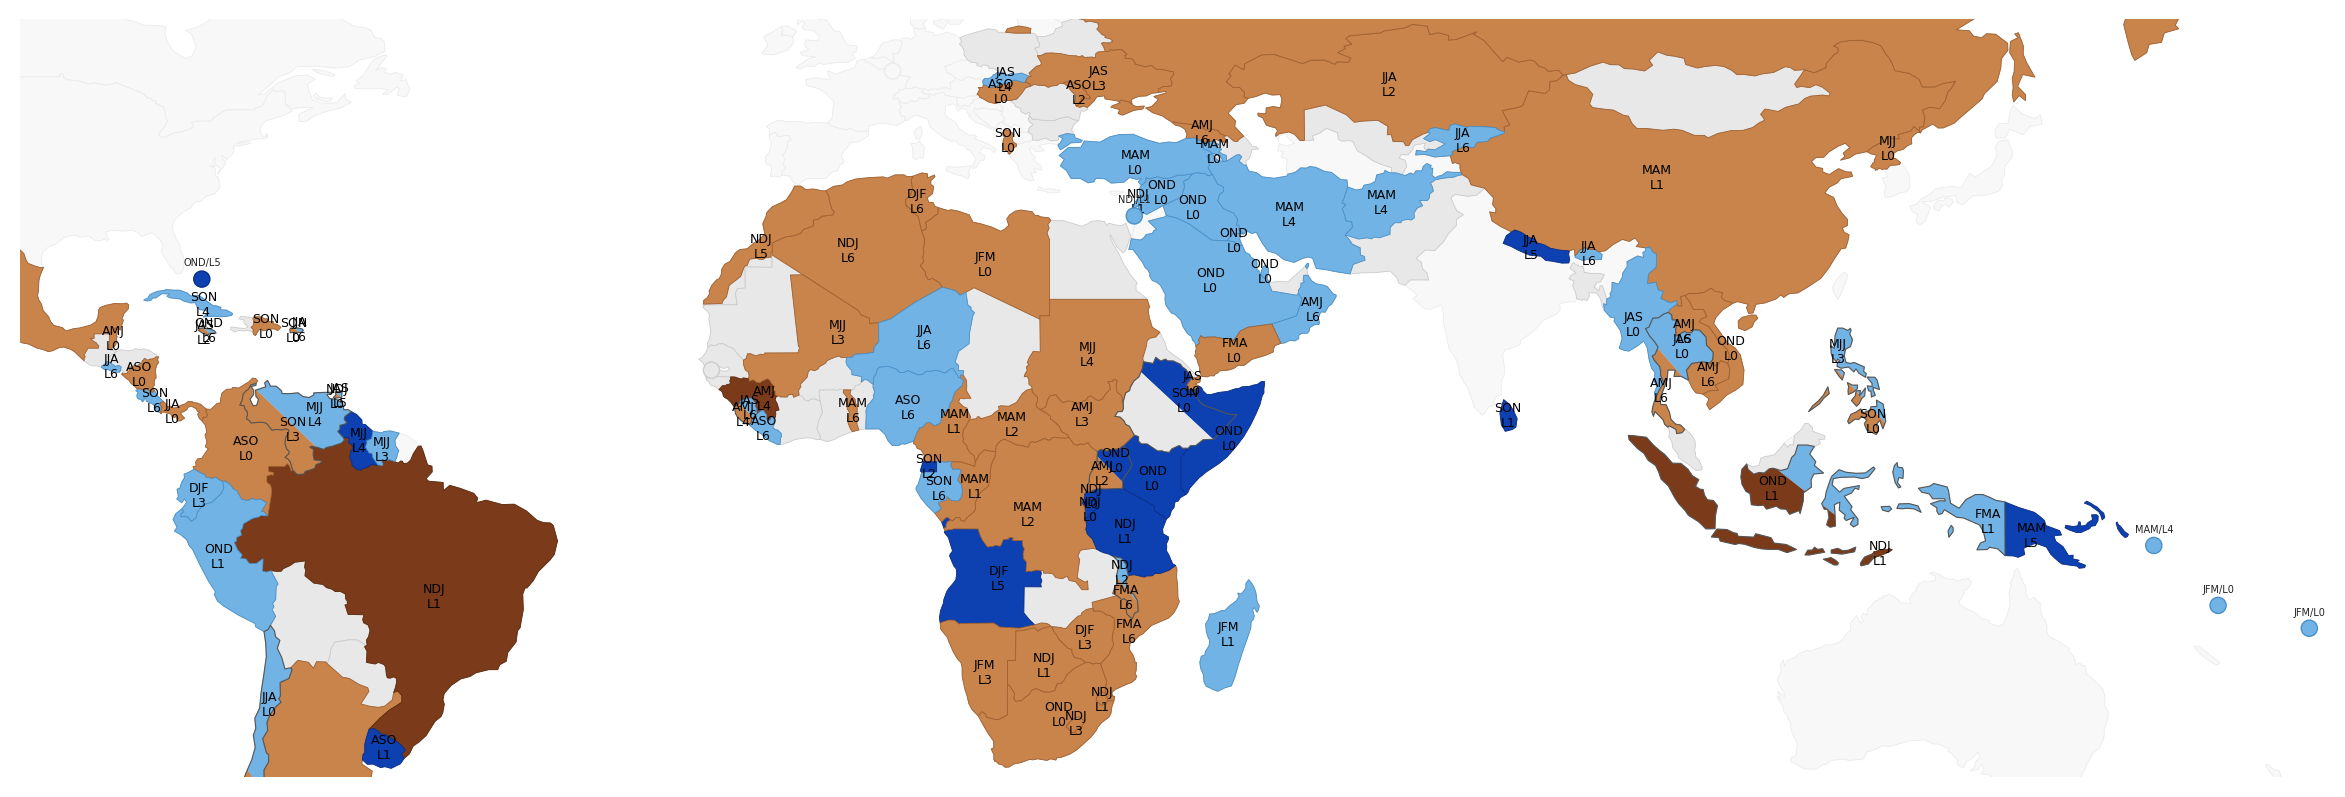
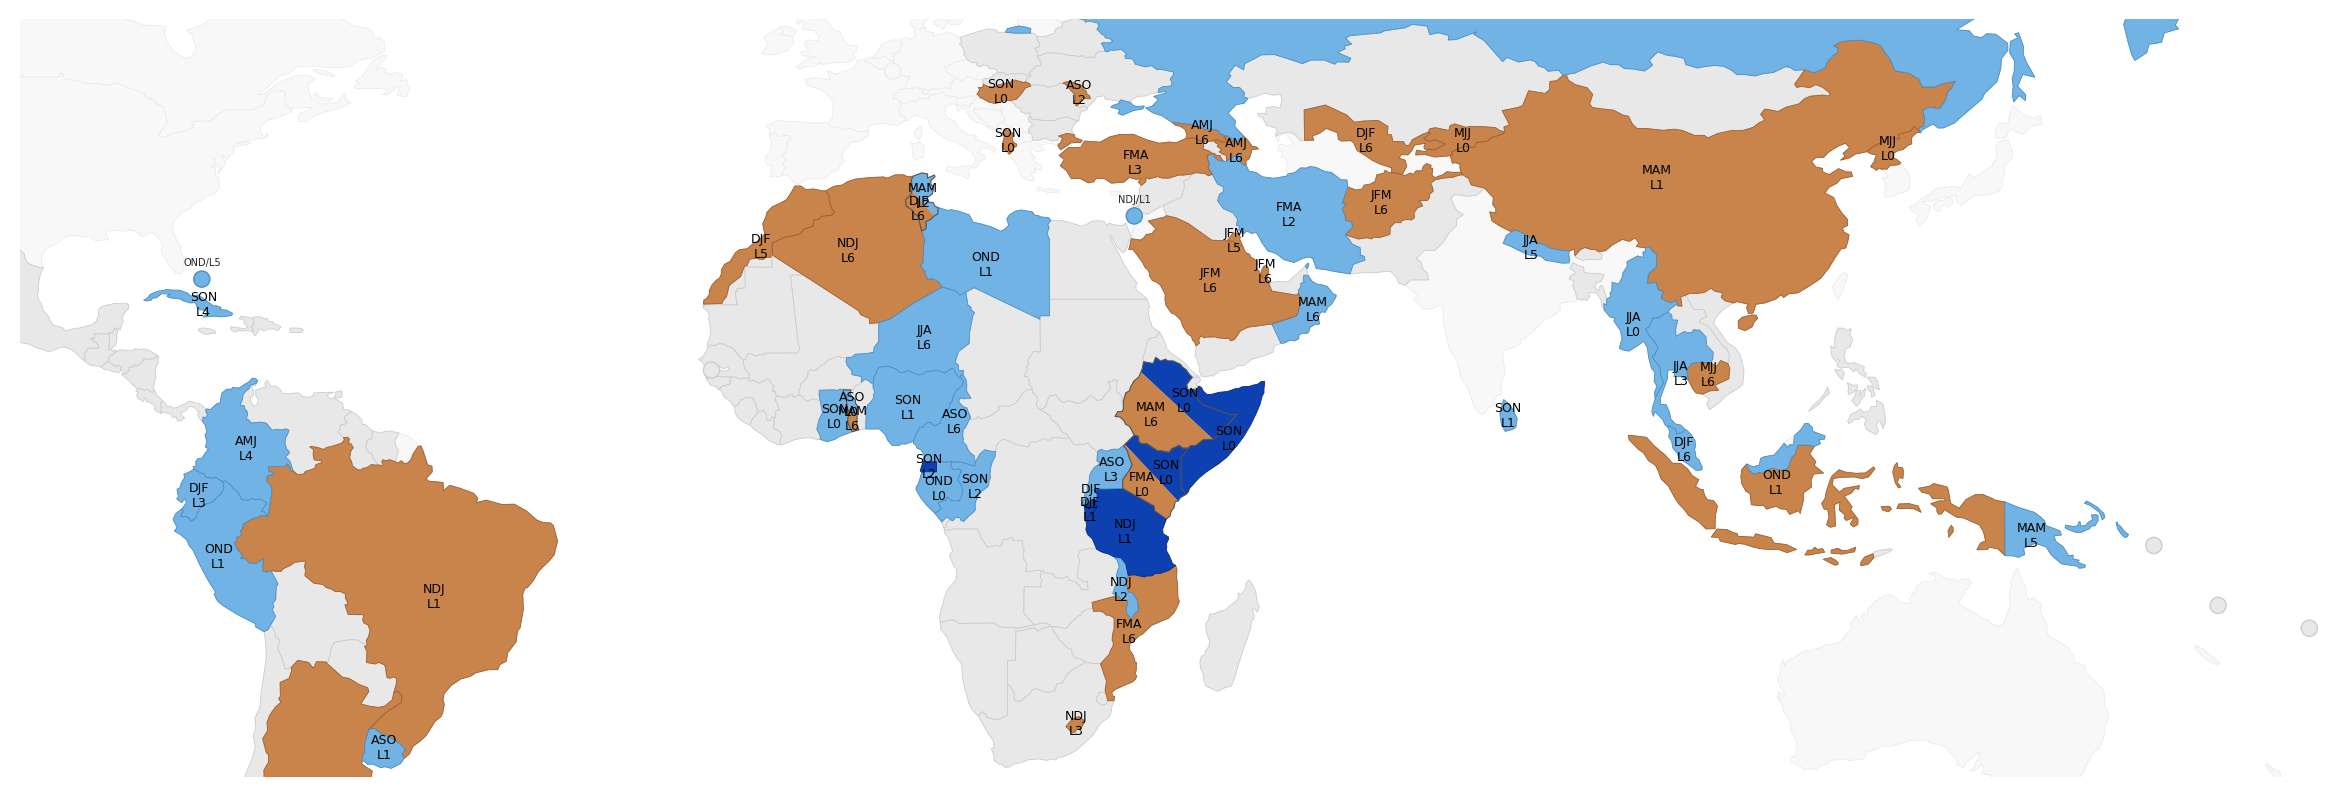
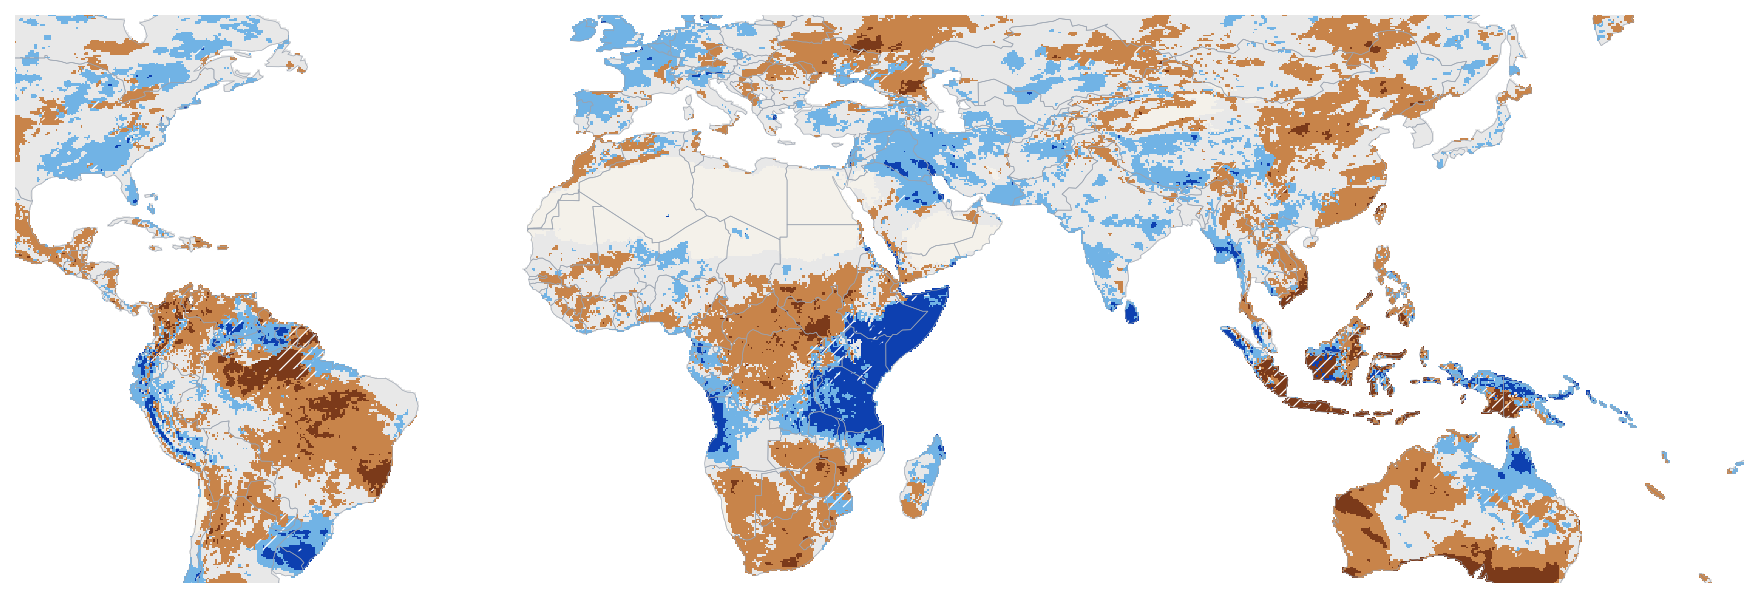
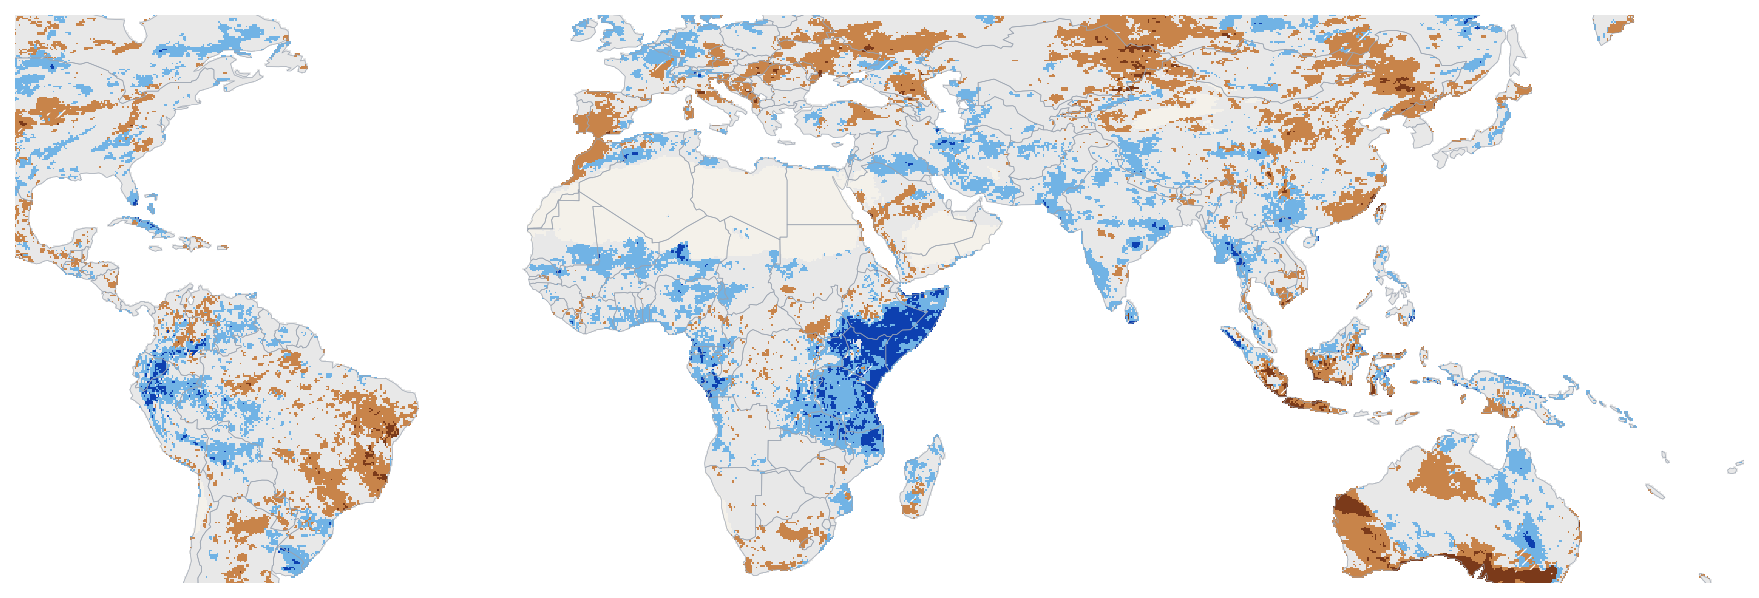
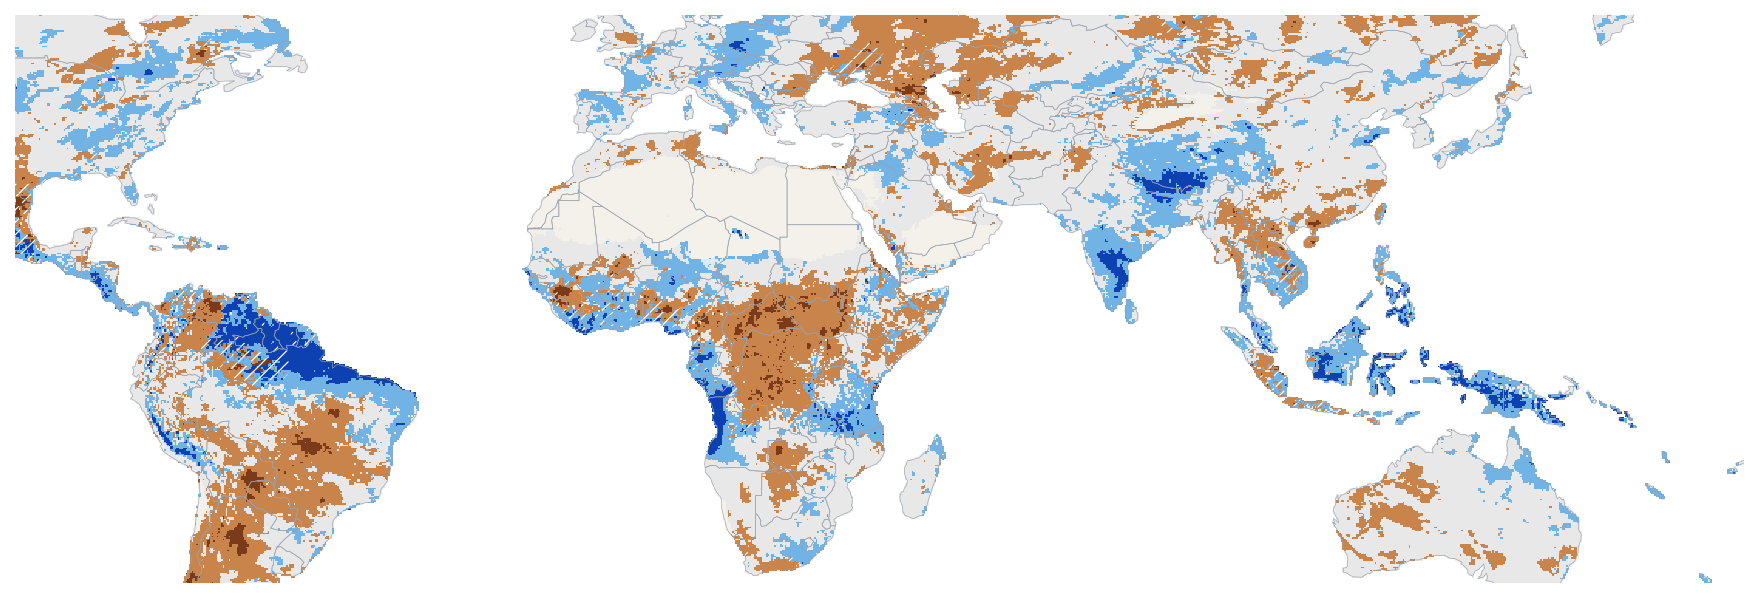
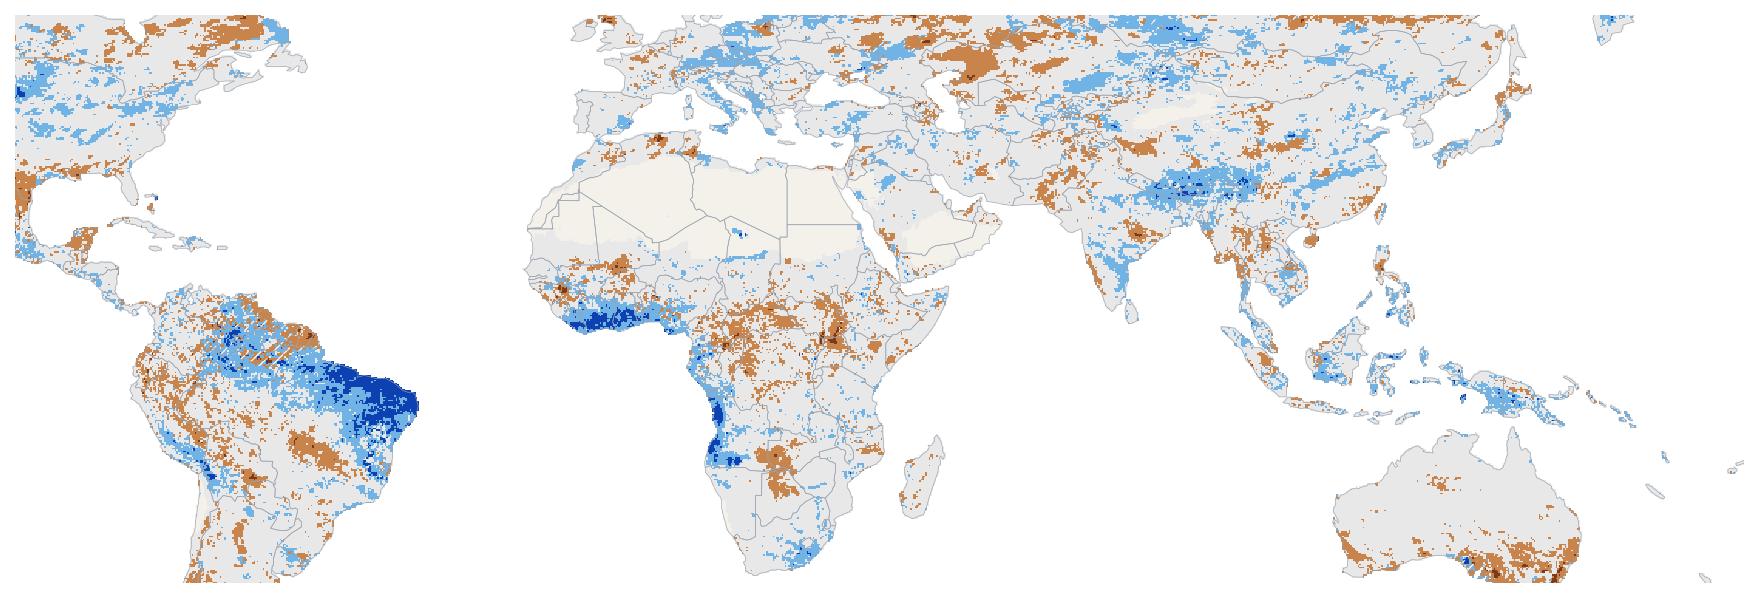
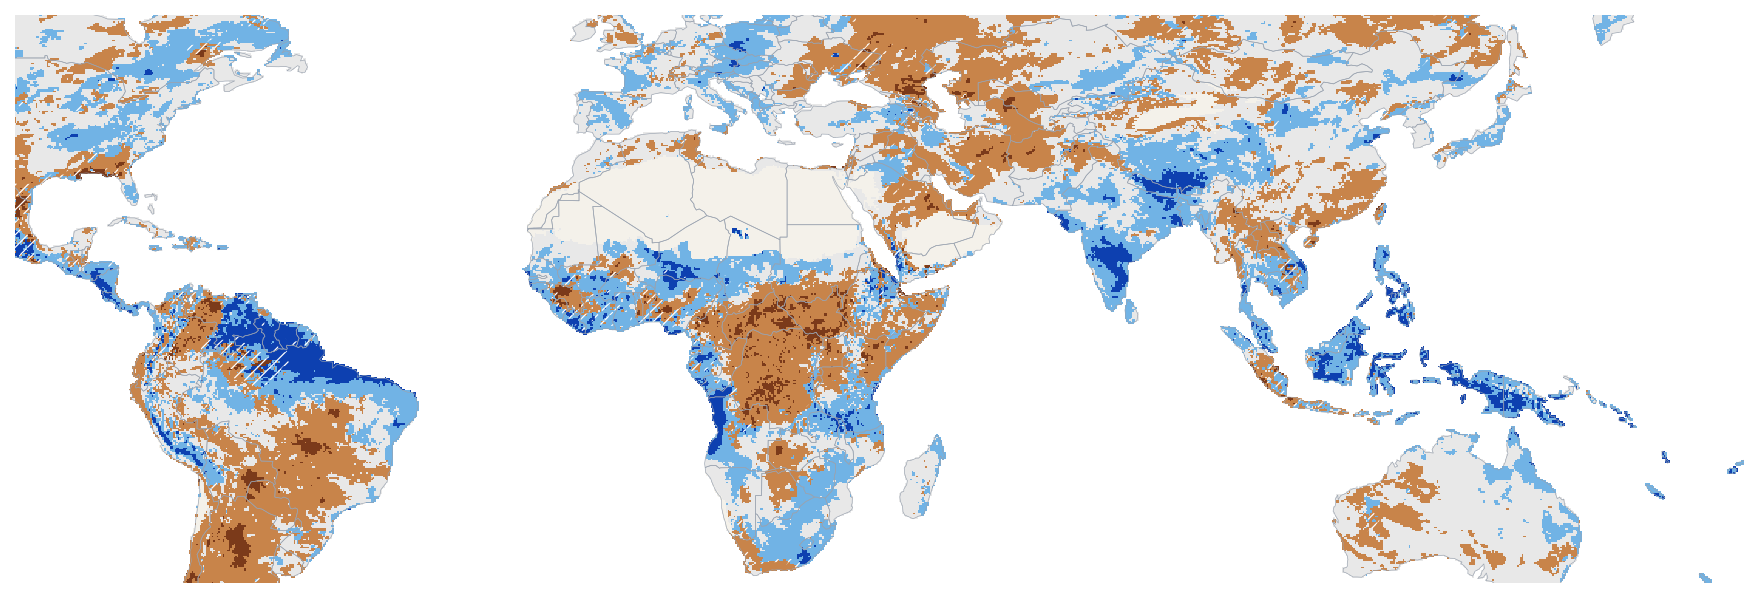
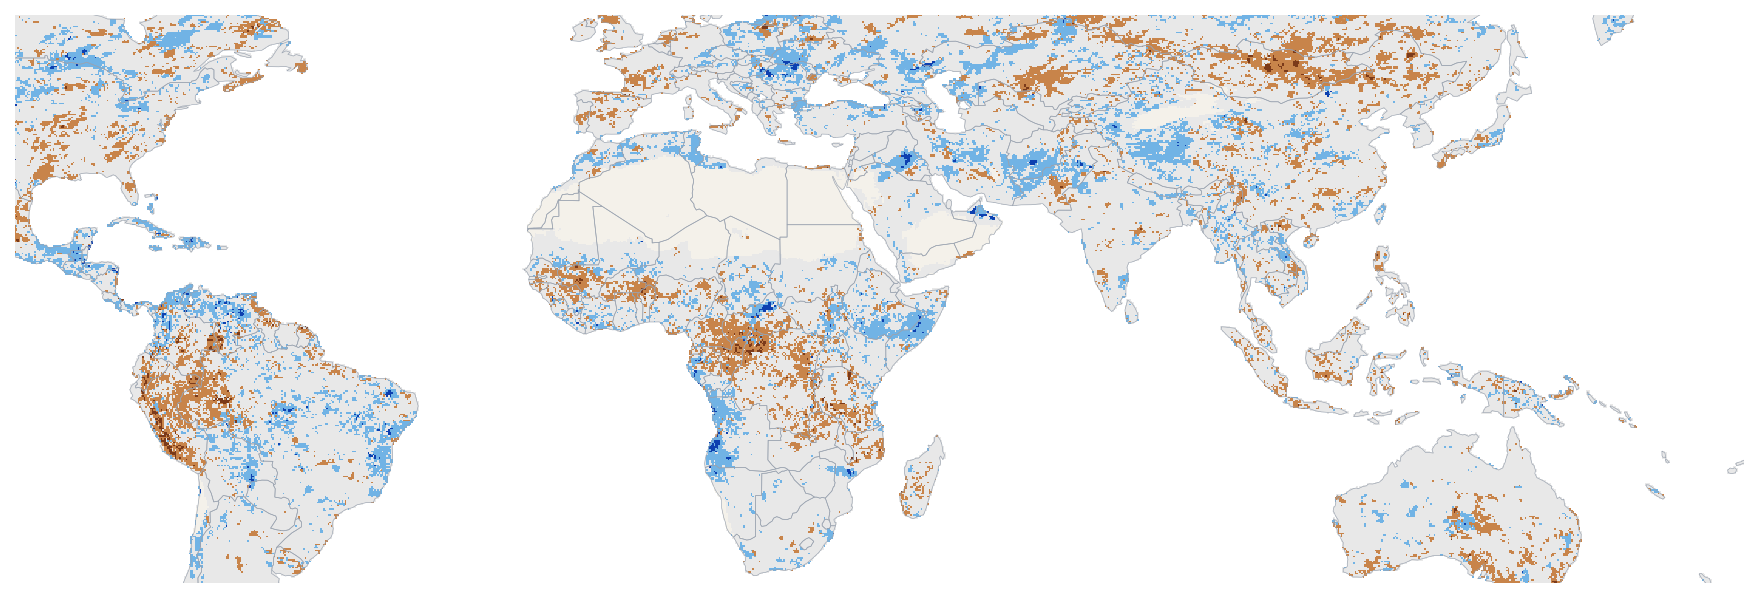
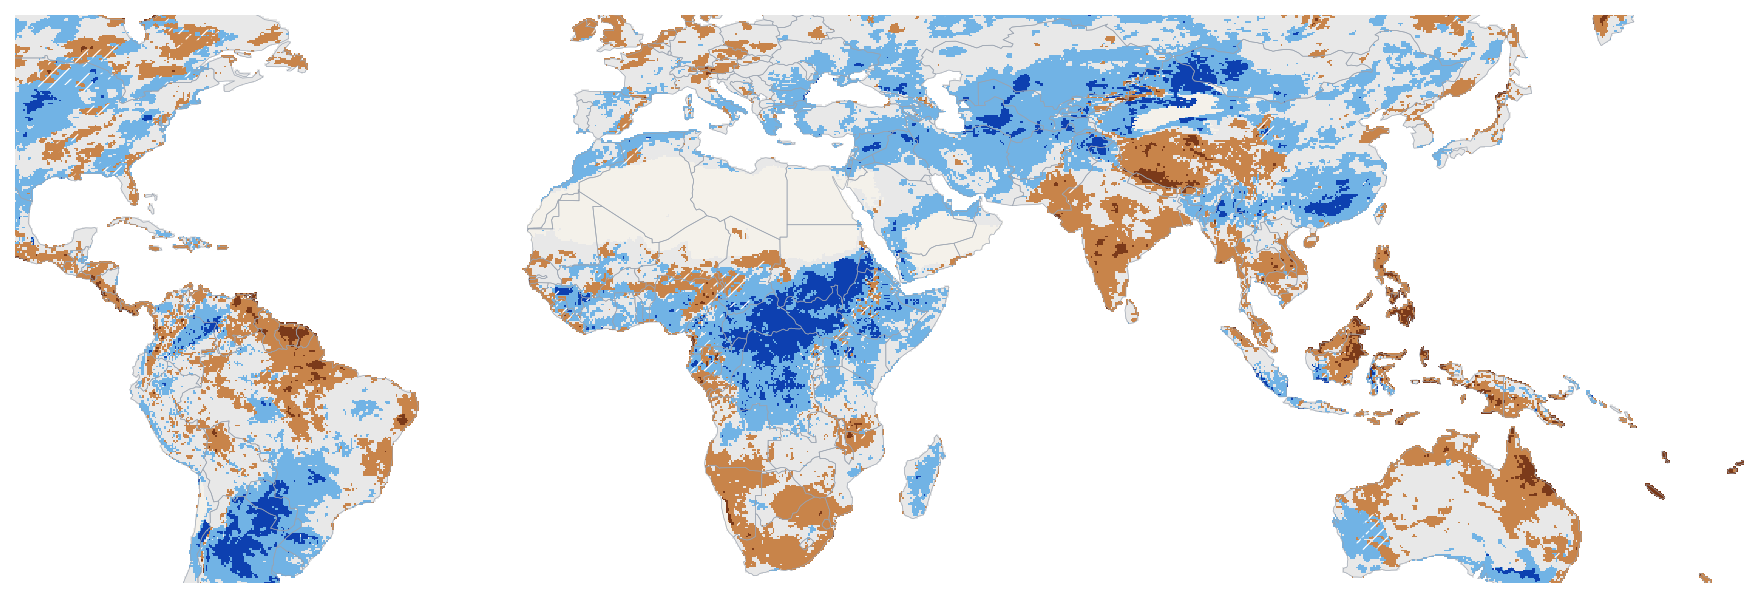
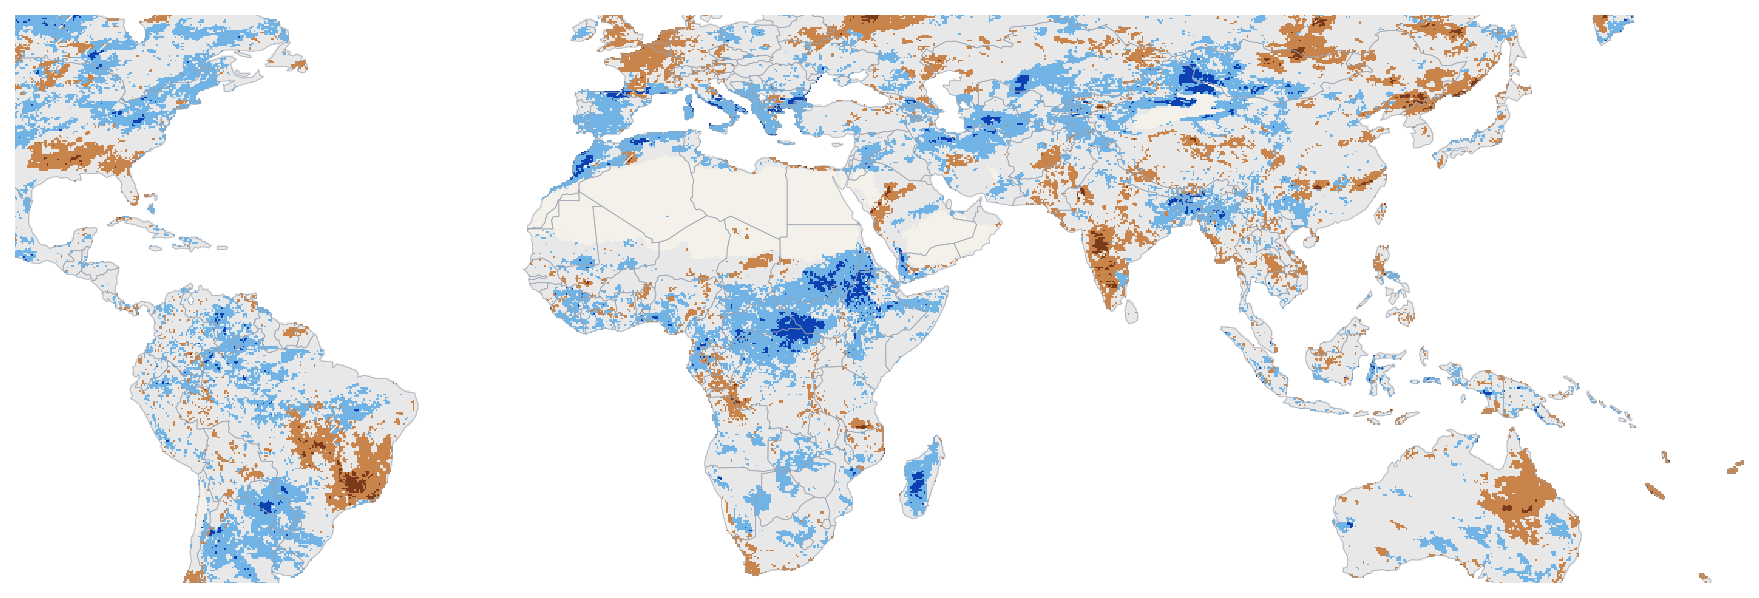
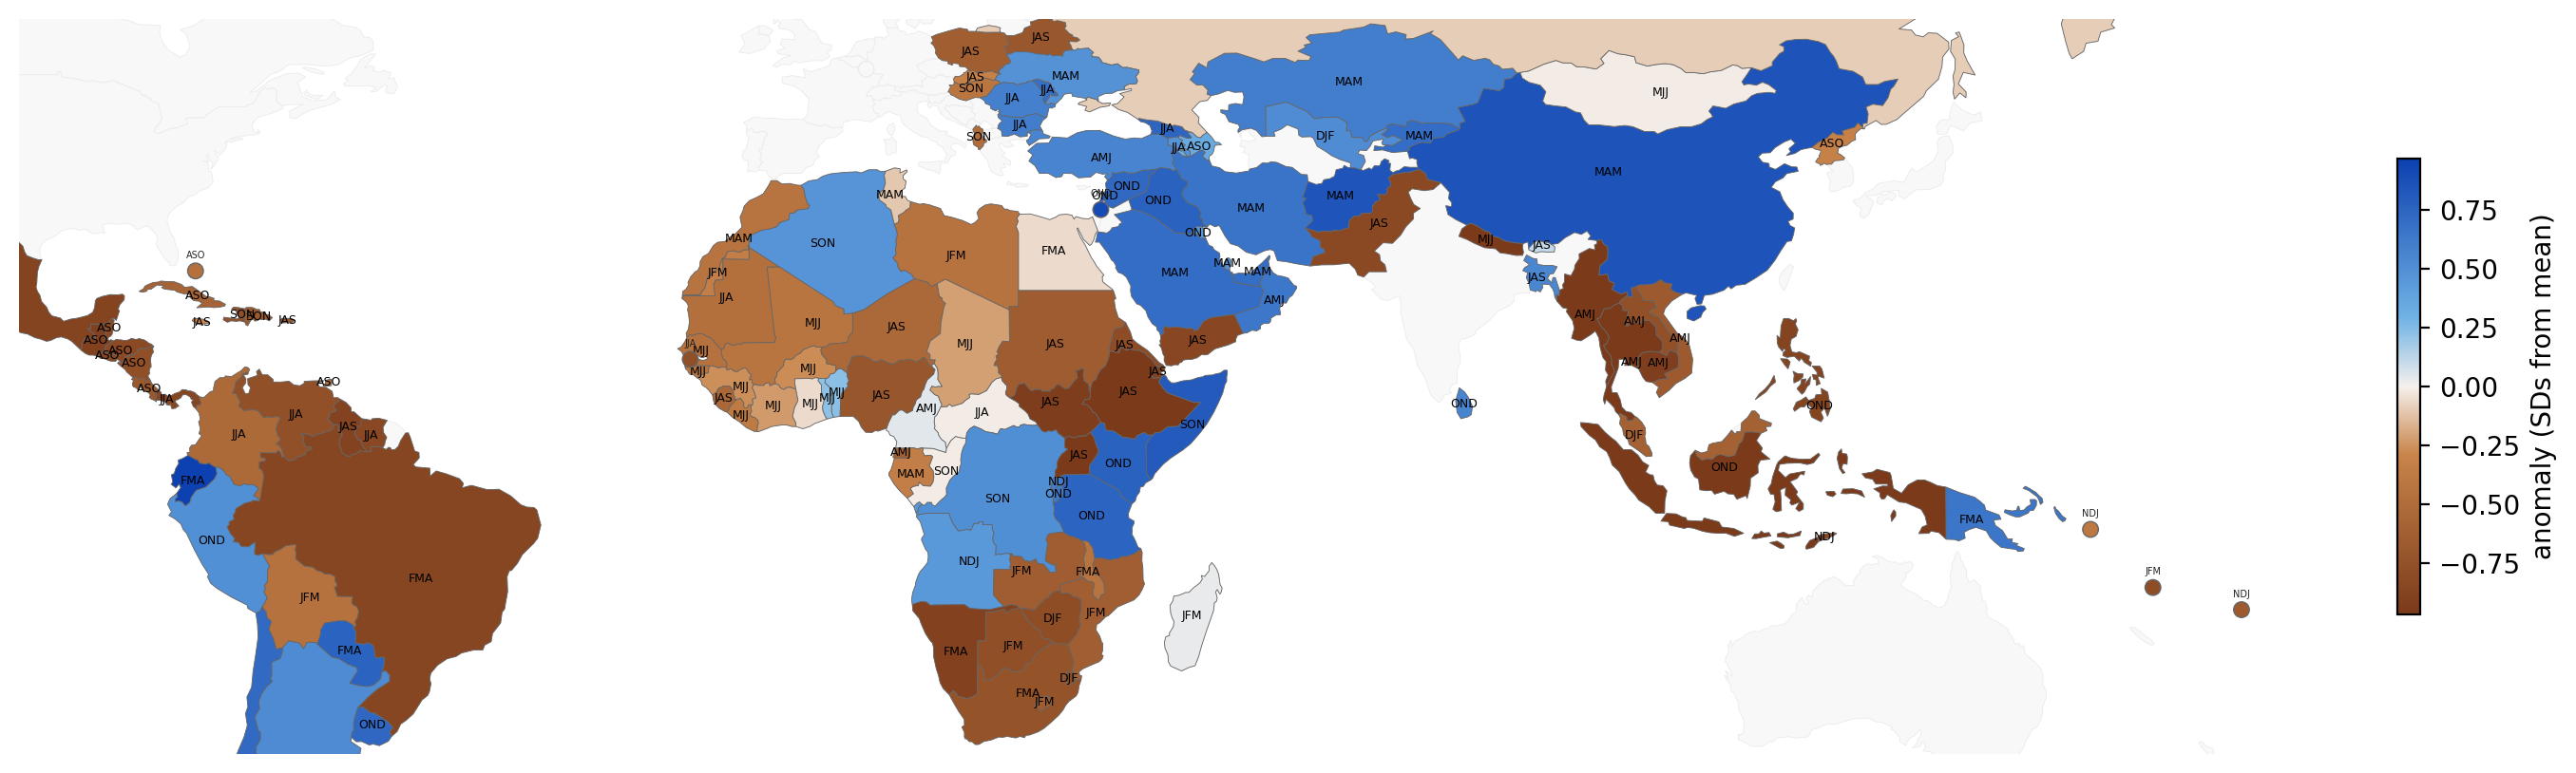
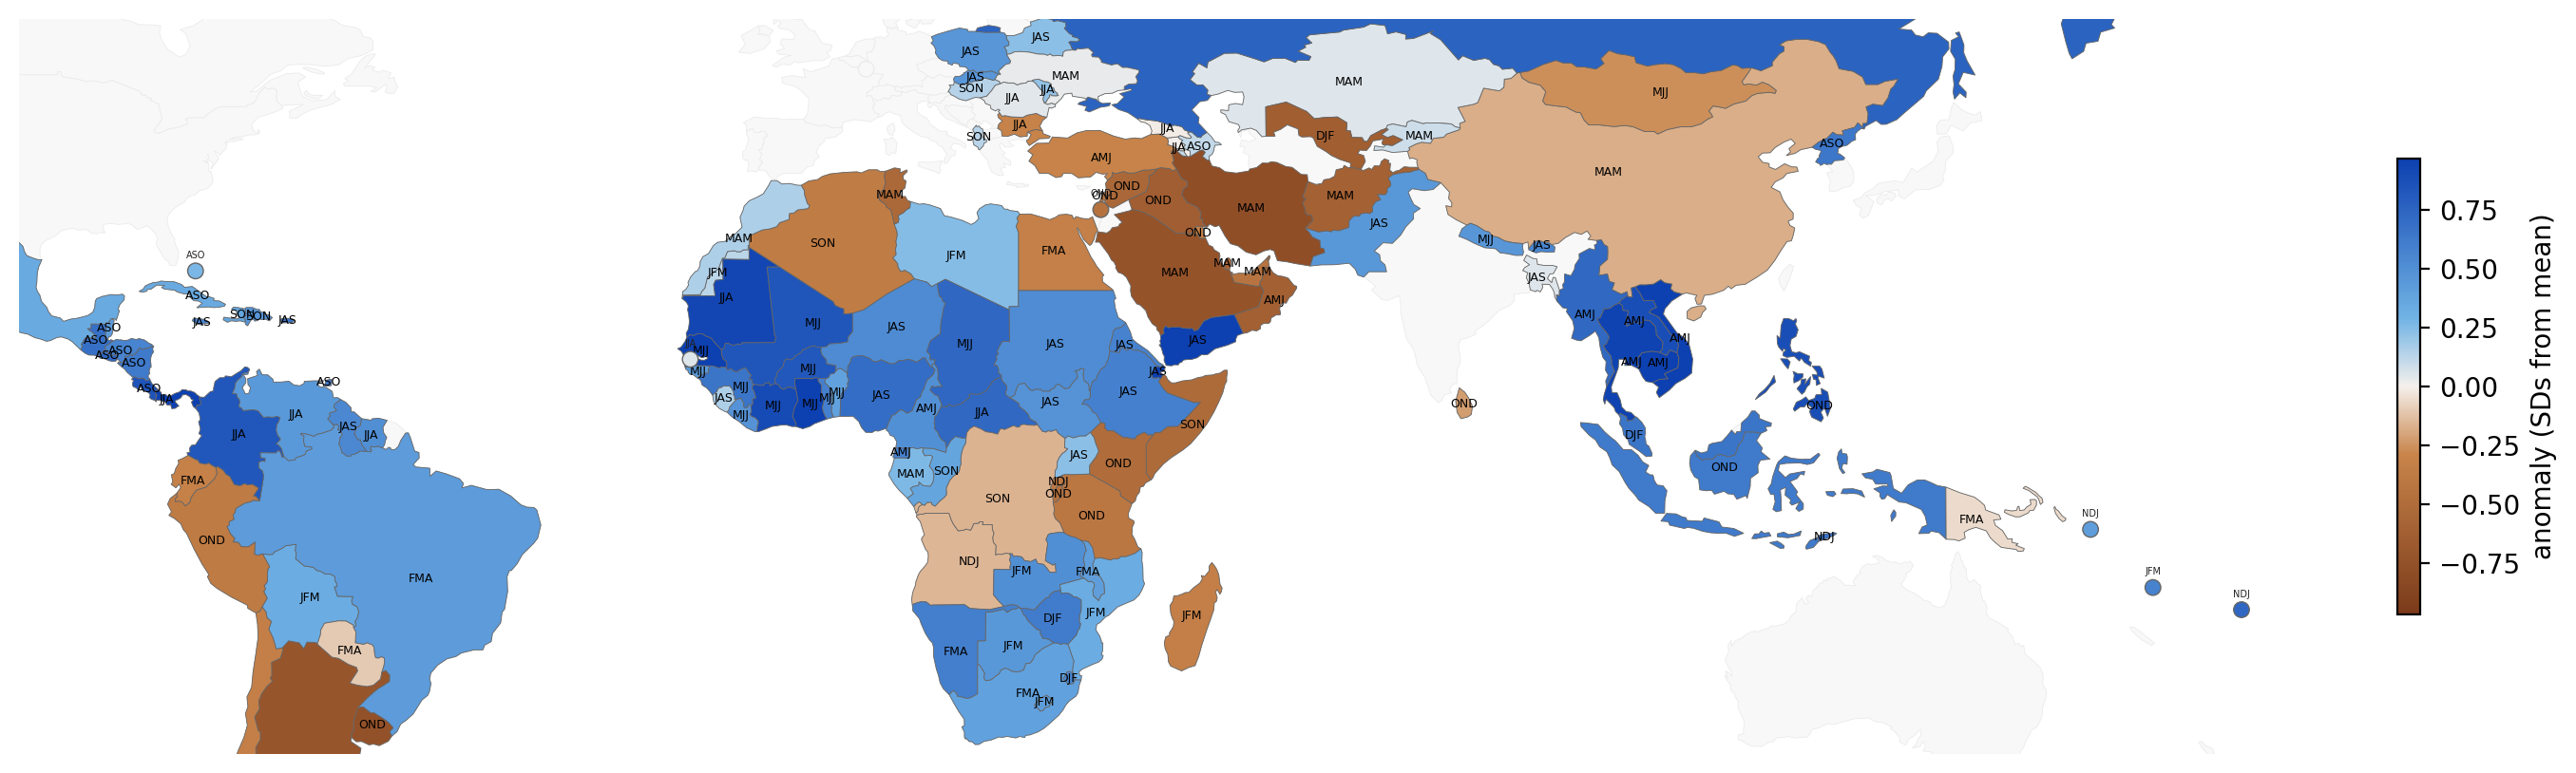
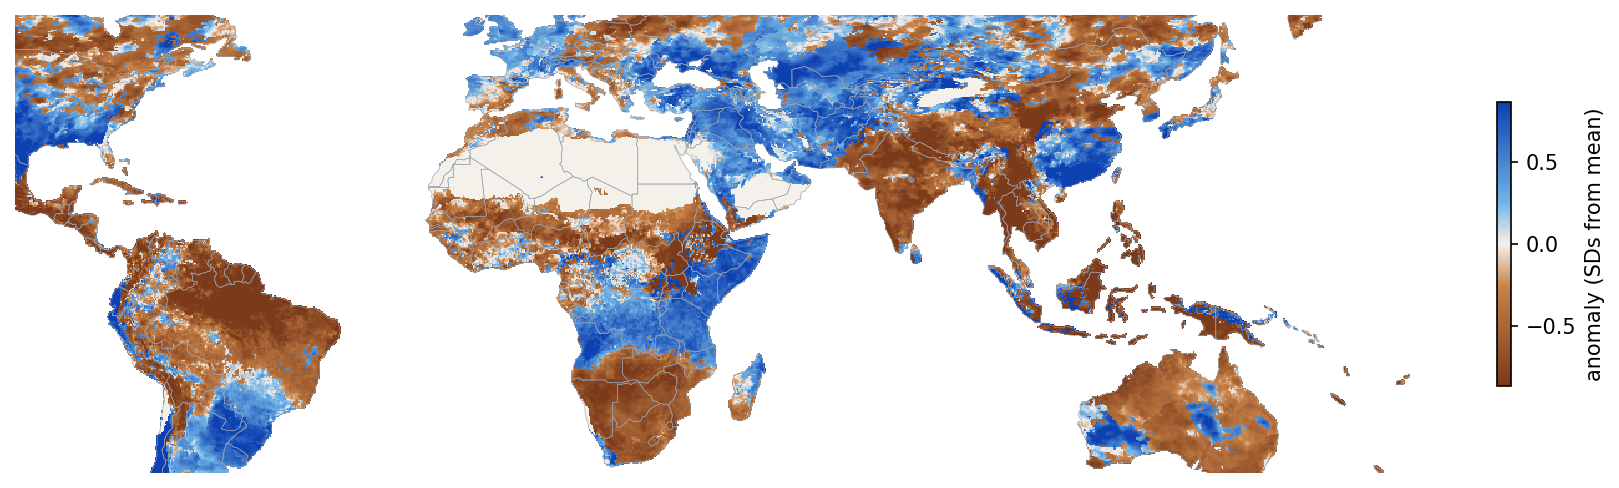
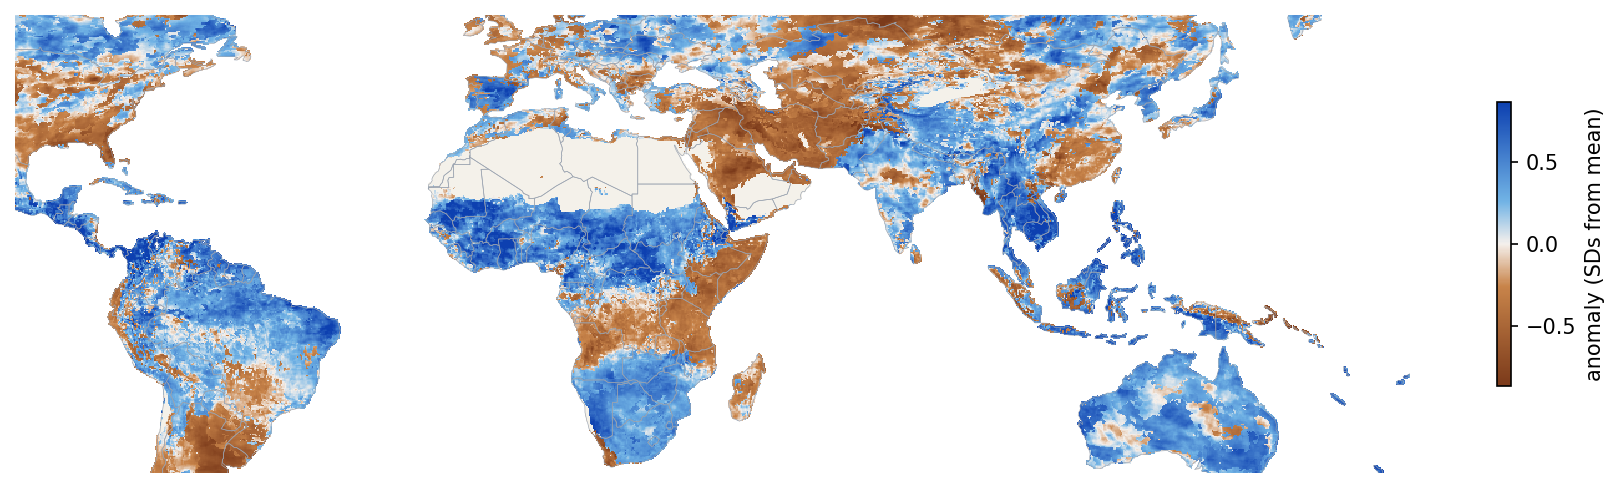
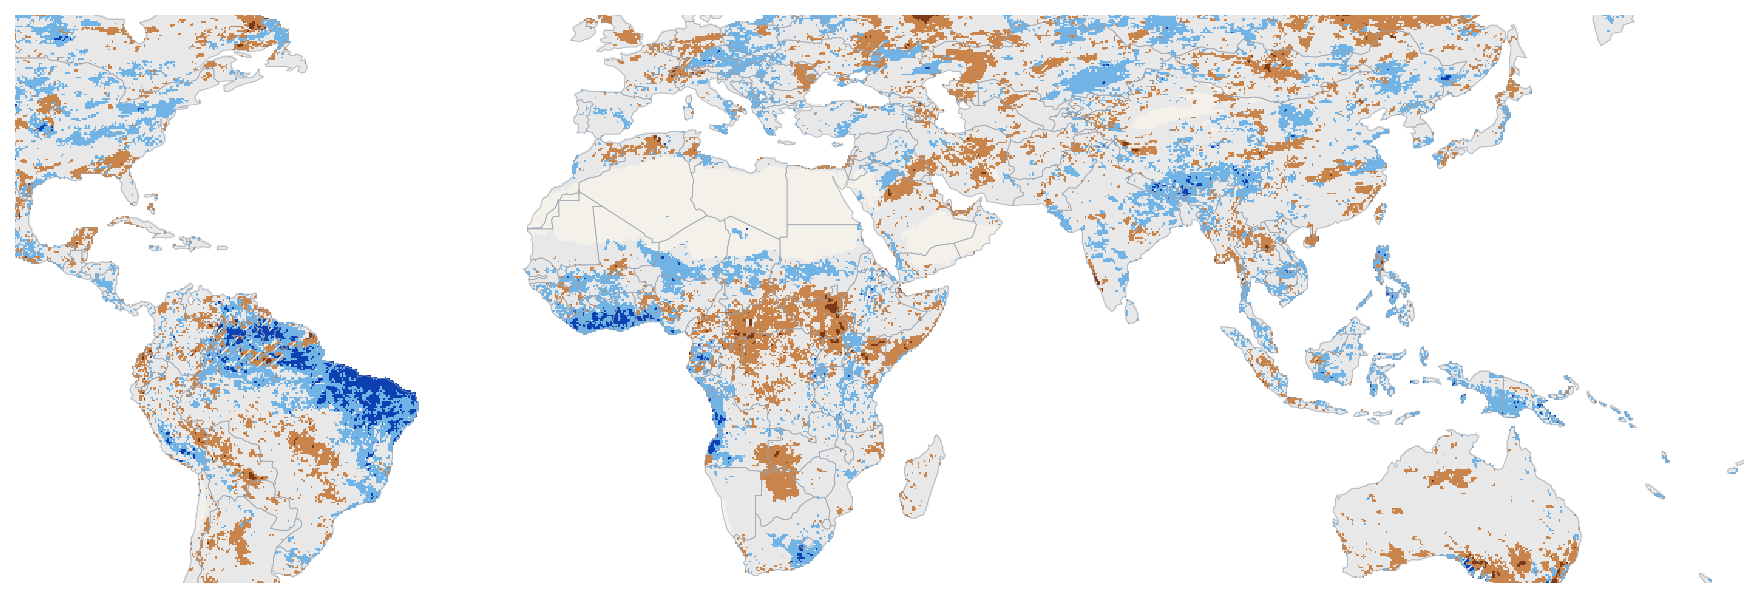
Mean rainfall anomaly (standard deviations from climatology) in each unit's headline trimester when Niño3.4 ≥ ±0.5 concurrent with that trimester. The two maps are independent — ENSO impacts are asymmetric. Respects the Resolution toggle above.

El Niño composite — mean anomaly when Niño3.4 ≥ +0.5 (brown = drier than normal, blue = wetter).

La Niña composite — mean anomaly when Niño3.4 ≤ −0.5. Roughly opposite to El Niño in ENSO-sensitive regions, but magnitude and pattern differ.

El Niño composite (0.25° grid) — mean anomaly when Niño3.4 ≥ +0.5 (brown = drier than normal, blue = wetter), scored per cell in its own headline season.

La Niña composite (0.25° grid) — mean anomaly when Niño3.4 ≤ −0.5.
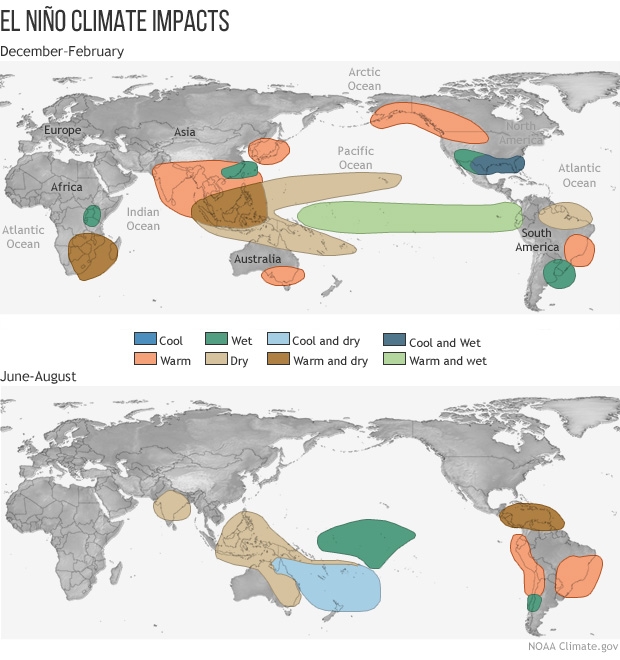
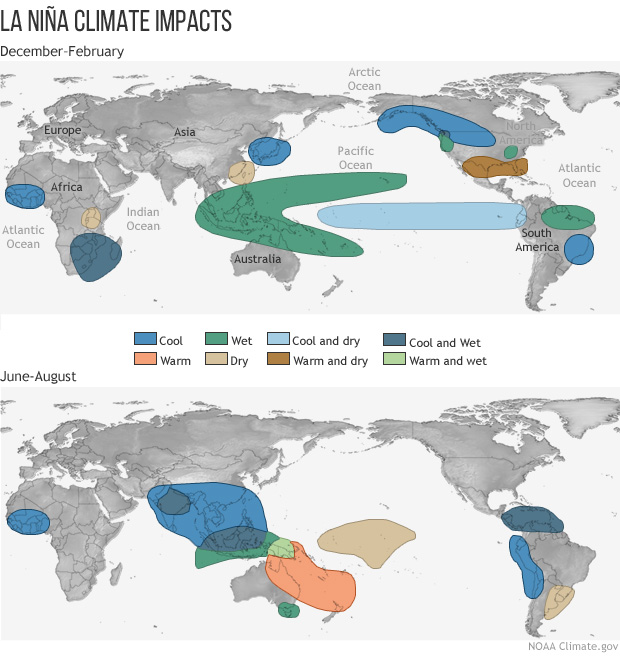
Generalized seasonal impact patterns associated with El Niño and La Niña, for context. These are schematic climatological composites, not derived from this analysis. Each map shows Northern Hemisphere winter (top) and summer (bottom). Source: NOAA PMEL, via climate.gov.
El Niño — typical global impacts for winter (top) and summer (bottom). Credit: climate.gov.
La Niña — typical global impacts for winter (top) and summer (bottom). Credit: climate.gov.
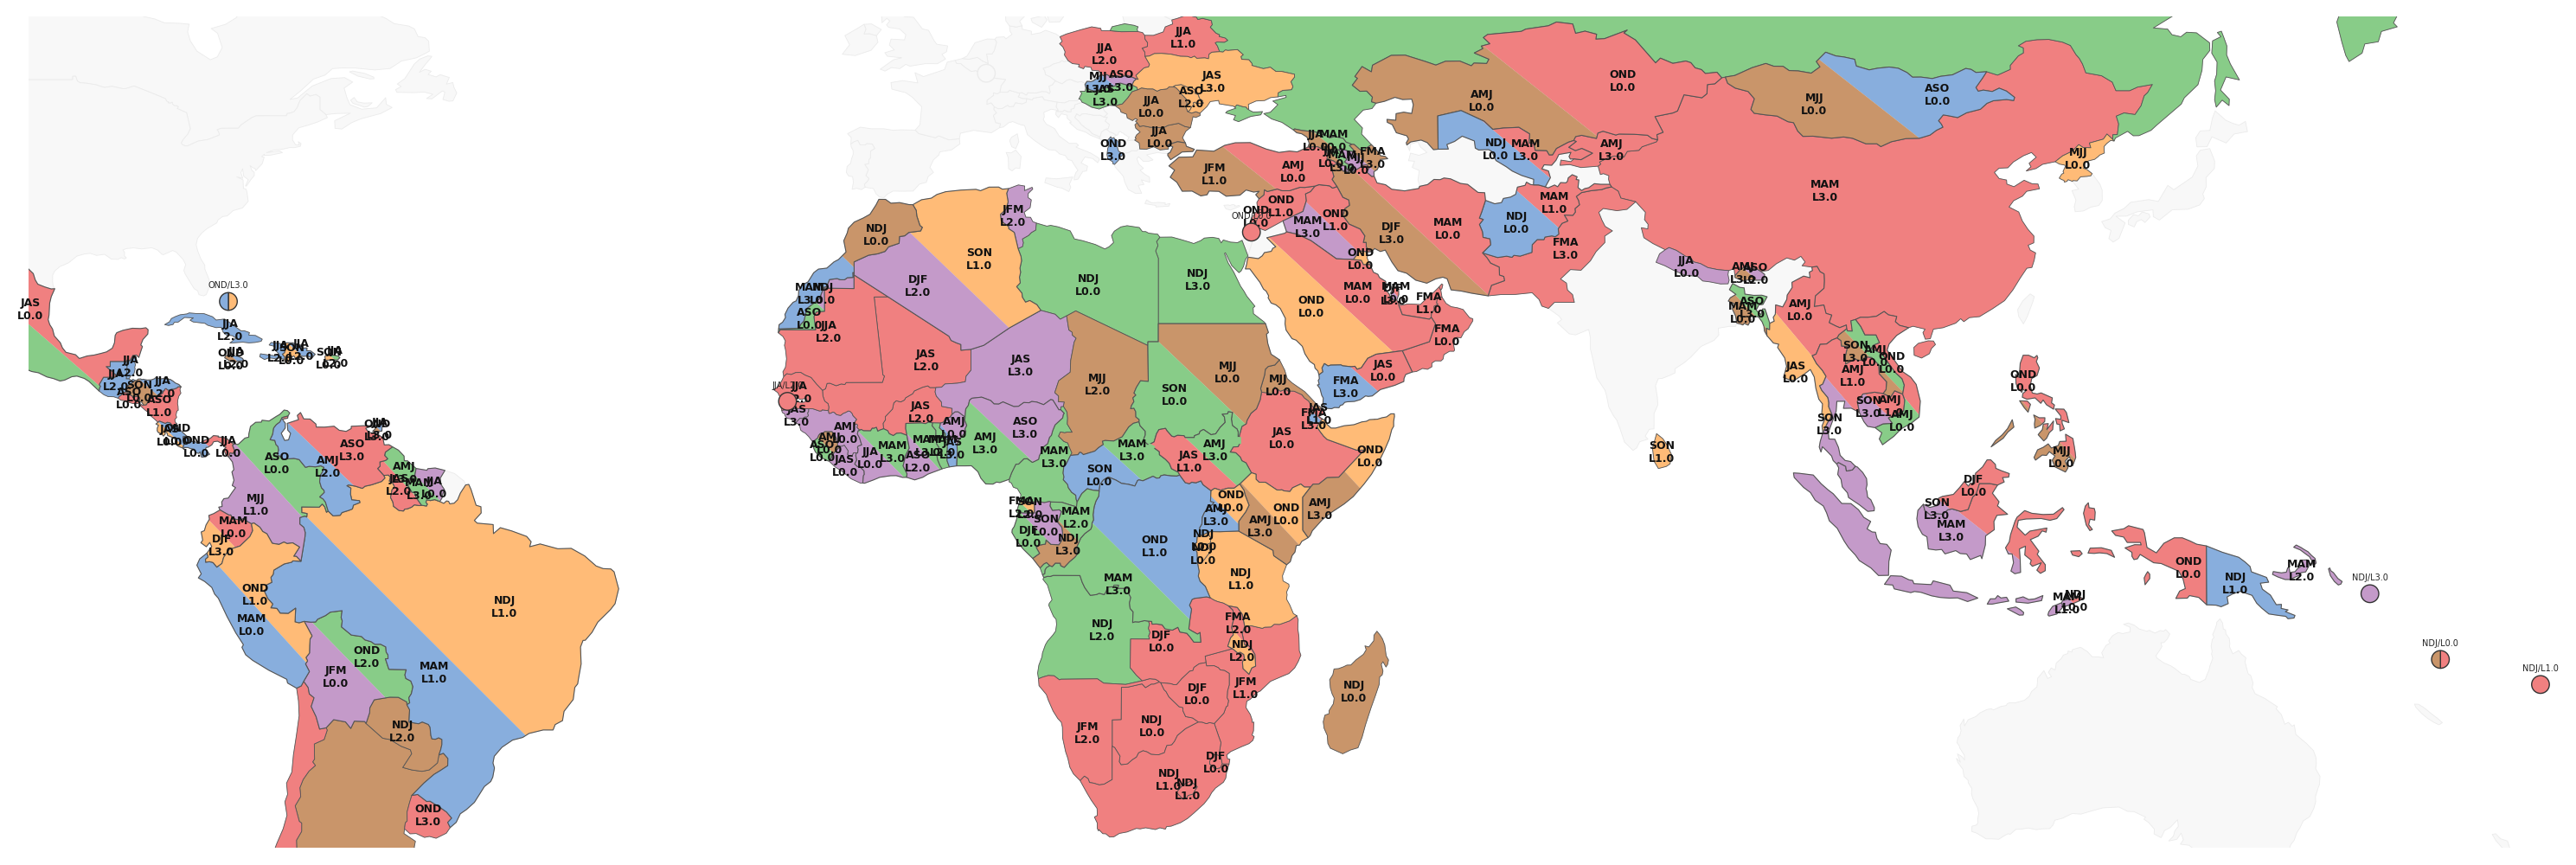
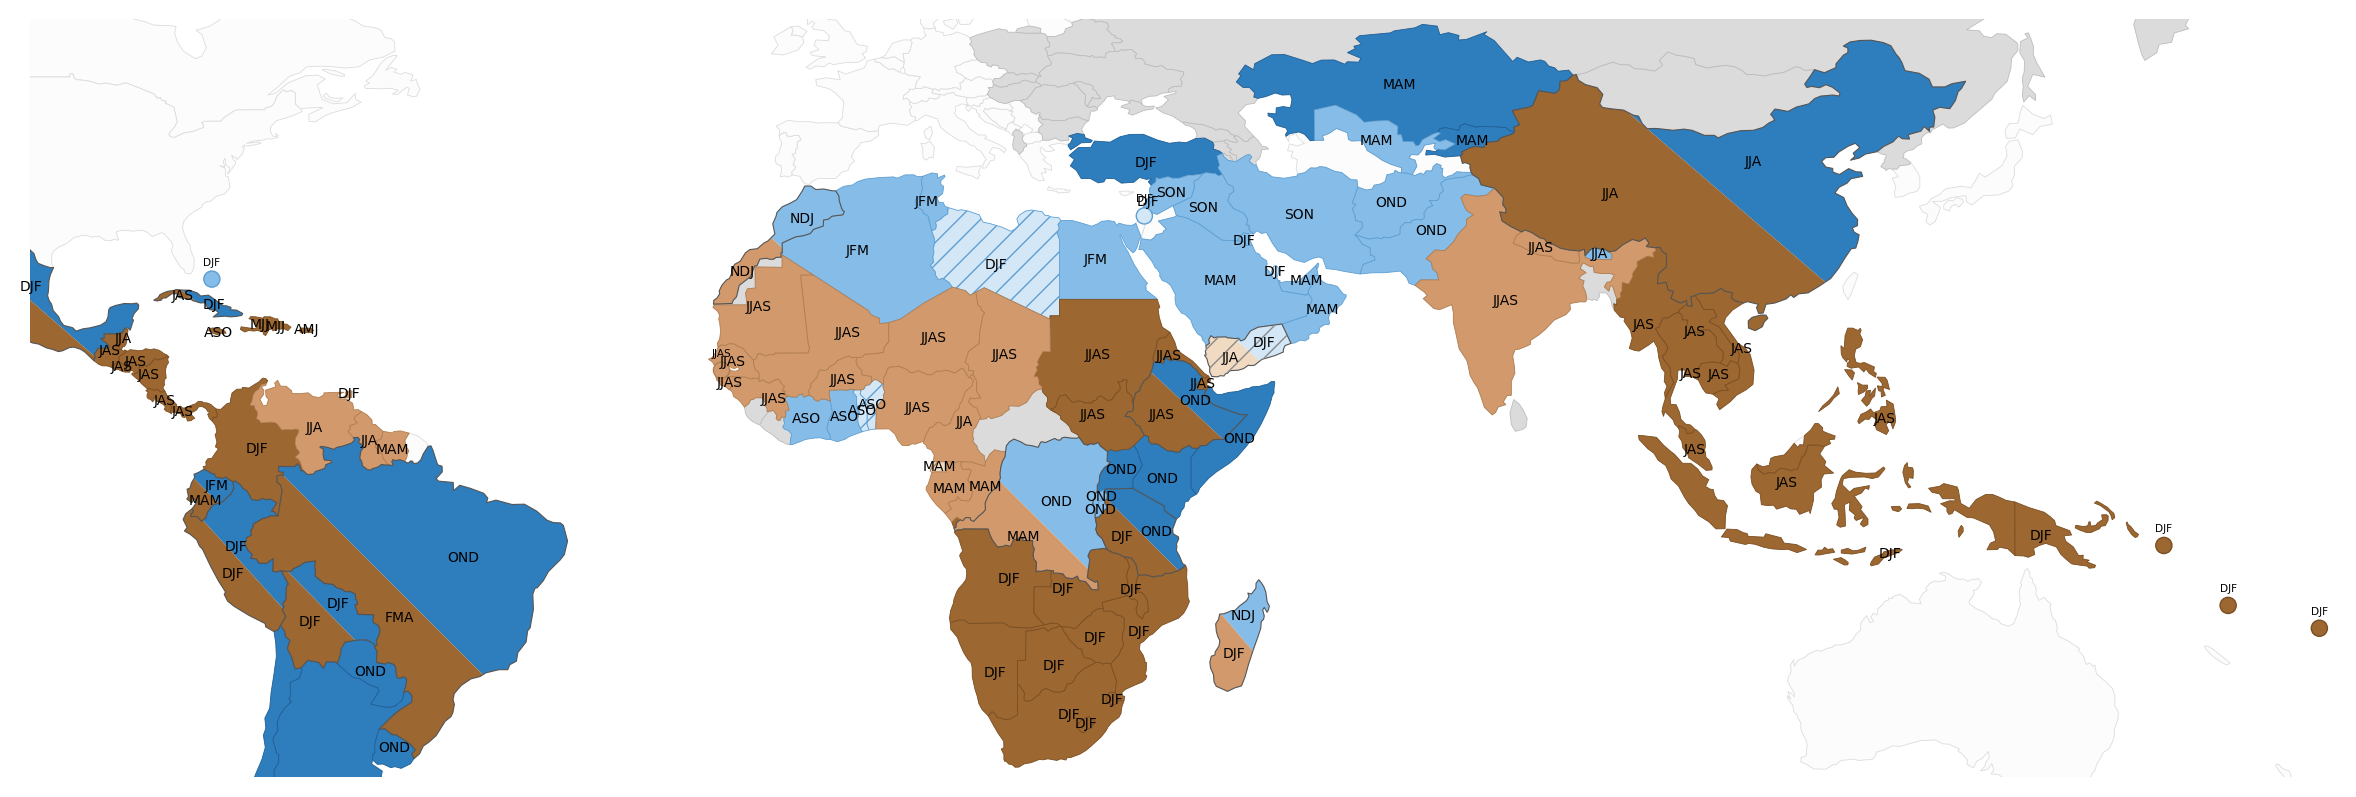
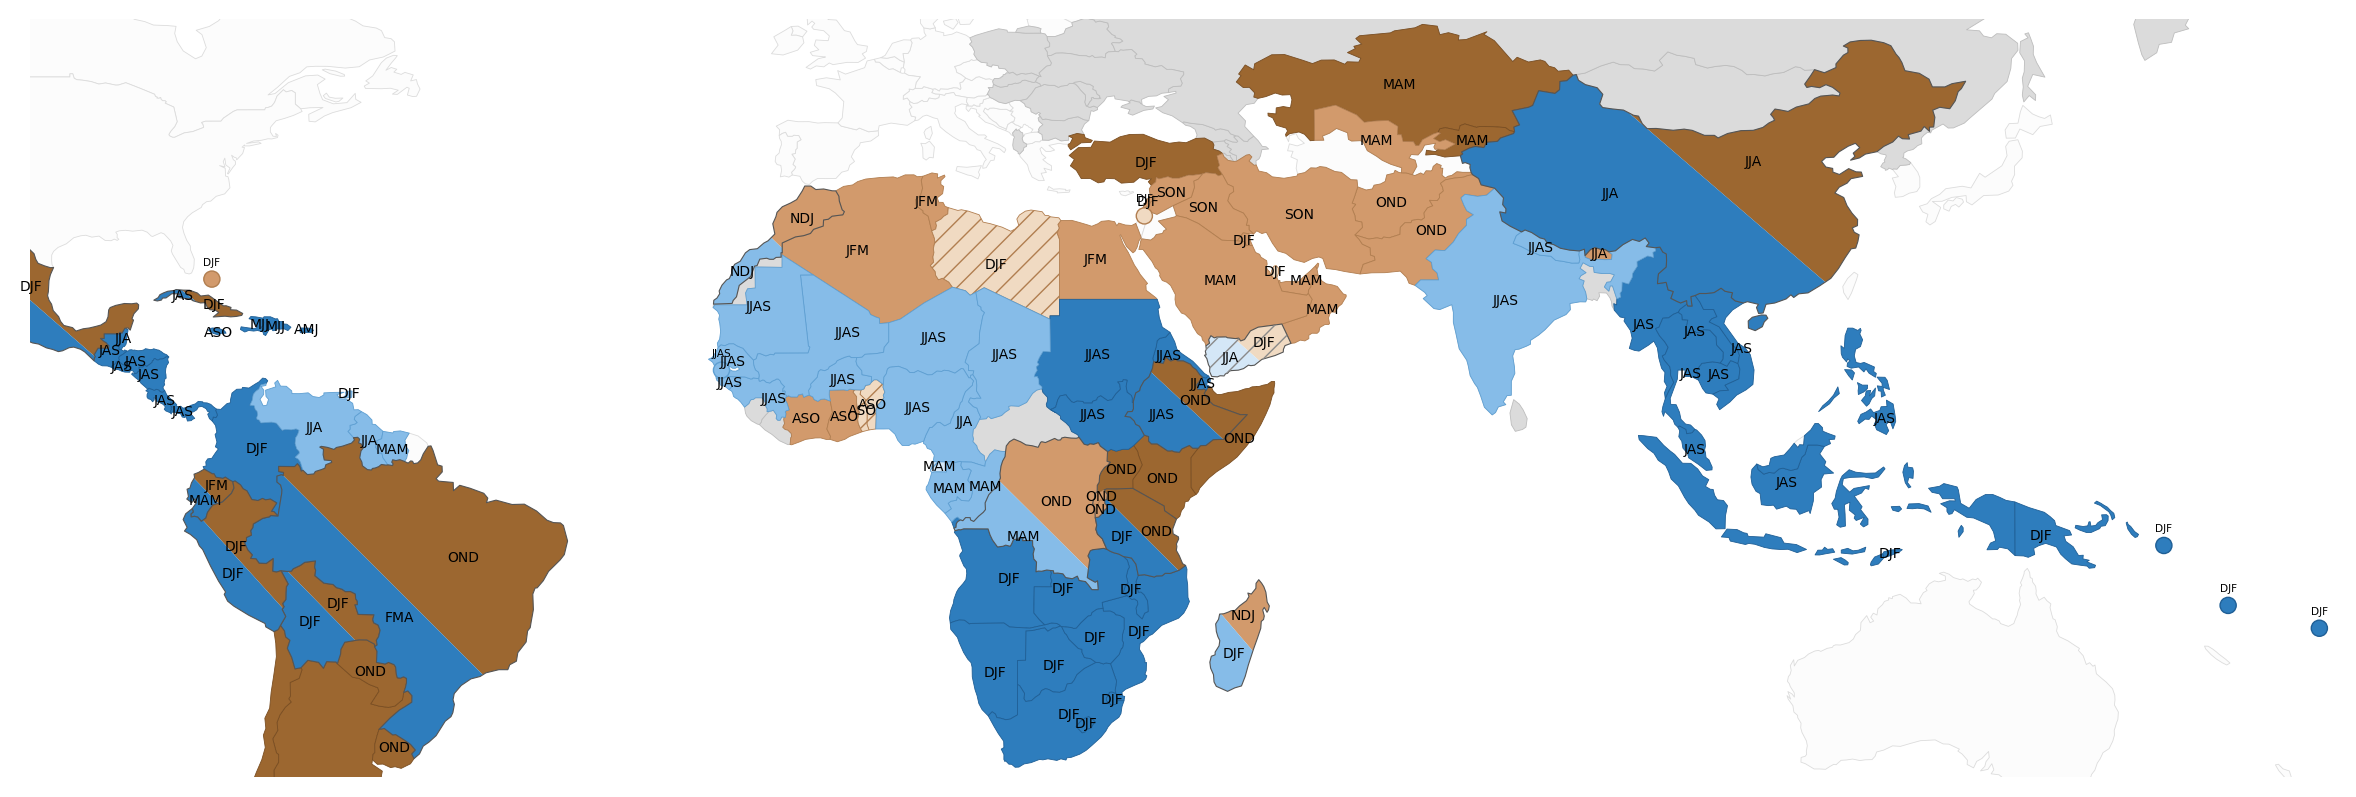
The generalized NOAA and IRI impact maps above are built from a few canonical global studies and miss several real teleconnections — most notably summer rainfall over highland Yemen and the southwestern Arabian Peninsula. The maps and table below are a curated, citation-backed catalogue of documented ENSO–seasonal-rainfall links covering all 153 monitored countries (those in the ERA5 analysis), researched region by region from peer-reviewed literature plus authoritative operational sources (NOAA, IRI, ICPAC/IGAD). Rows tagged gap vs NOAA/IRI are well-supported in the literature yet absent or under-represented on the standard maps. The final column reports what this study's own ERA5 analysis found, as an independent check.

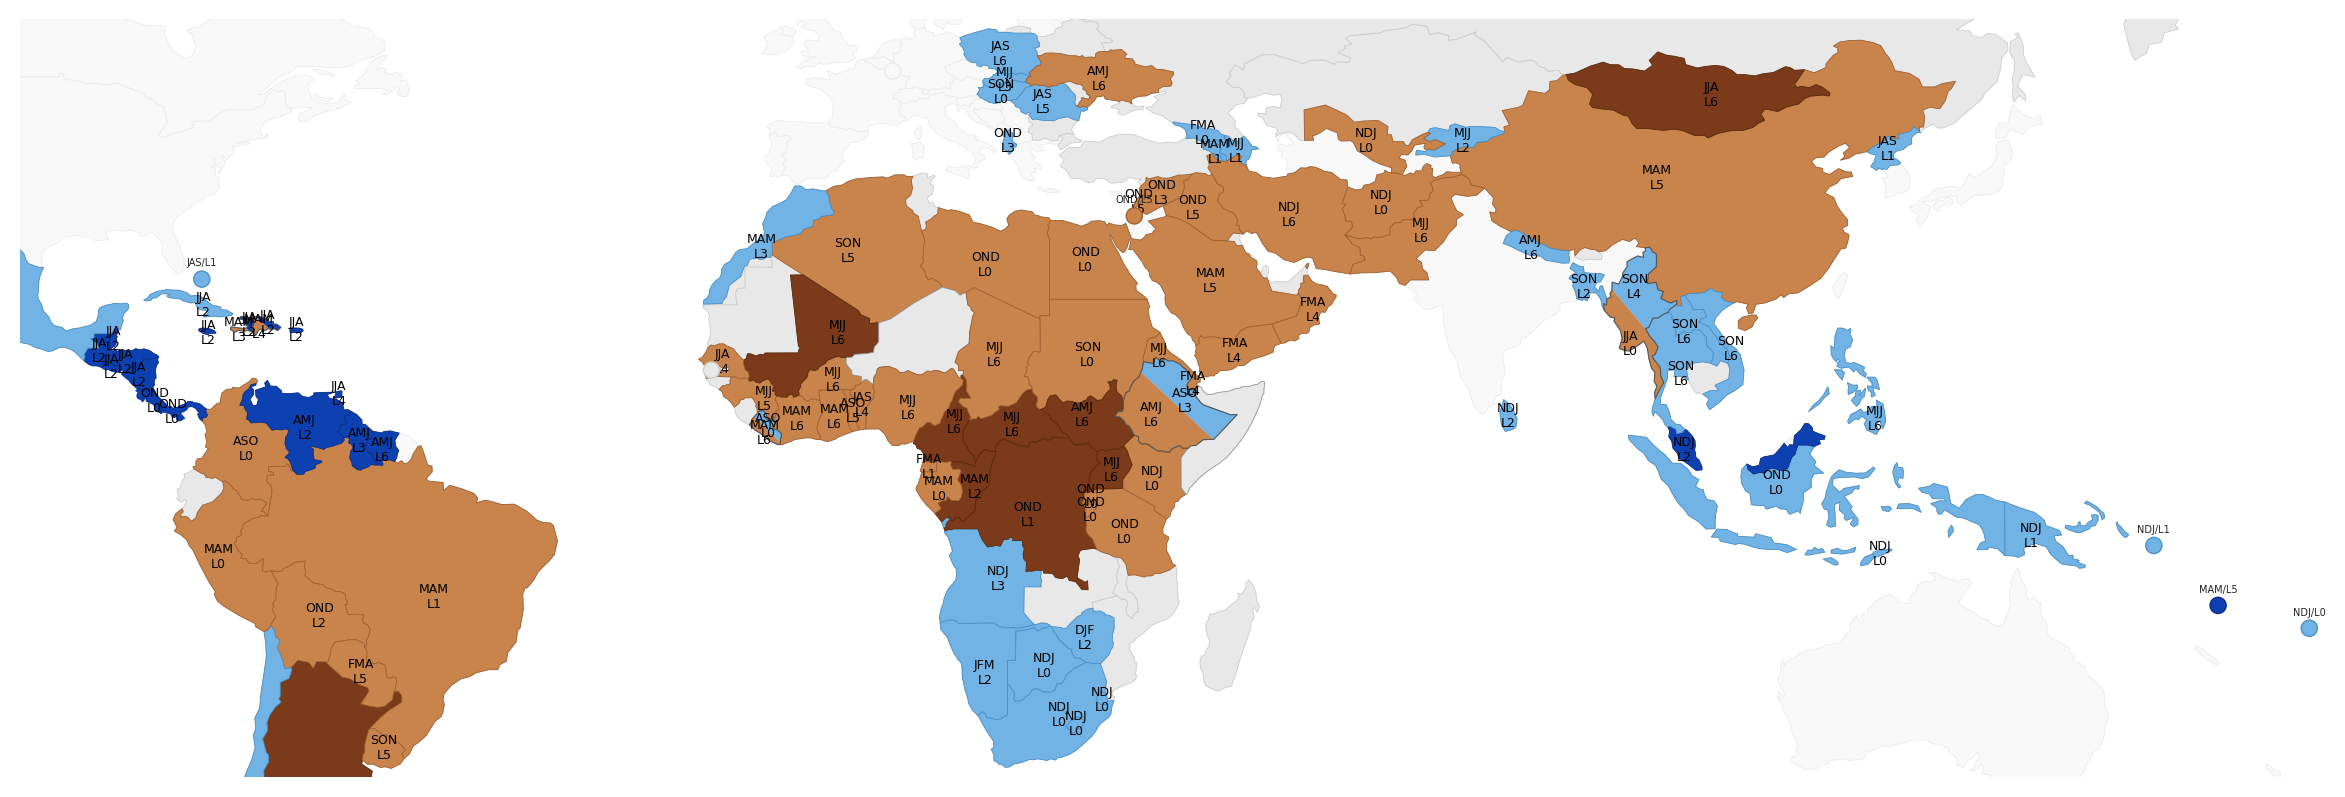
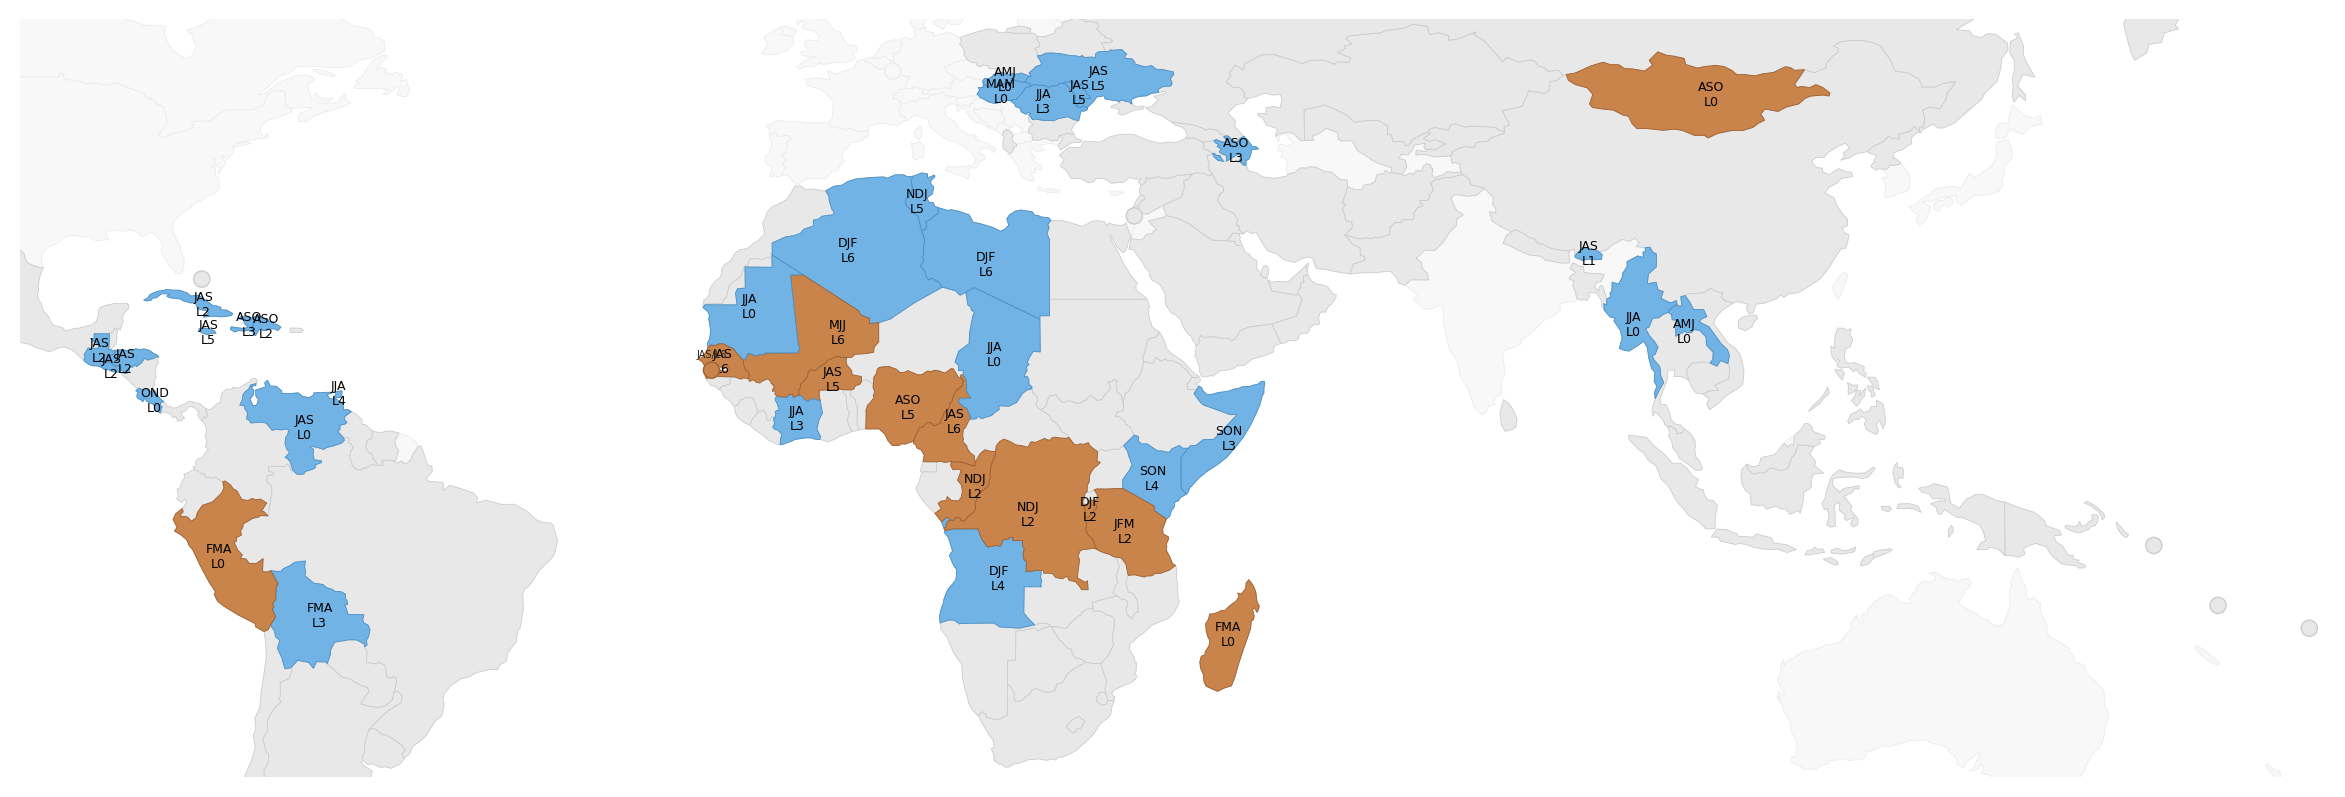
Showing El Niño — dominant documented rainfall response in each country's main humanitarian rainy season.
Countries whose seasons respond in opposite directions (e.g. Ethiopia, Yemen, Brazil, Peru, China) are split; 3-month season codes (e.g. OND, JJAS, DJF) label each signal. Grey = monitored but no robust documented ENSO link in the literature; near-white = not monitored (not researched — e.g. USA, most of Europe). The curated highlights are in the table; every monitored country is in the collapsible catalogue below.
| Region / area | Season | El Niño | La Niña | Evidence & source | This study (ERA5) |
|---|---|---|---|---|---|
| Horn of Africa Kenya, S. Somalia, SE Ethiopia | OND “short rains” | wetter | drier | Robust, widely replicated Park et al. 2020 (JGR-A) | Agrees — SOM OND r=+0.65, KEN +0.58, ETH +0.59 |
| Horn of Africa Ethiopia / Sudan / S. Sudan highlands gap vs NOAA/IRI | JJAS (kiremt / Blue Nile) | drier | wetter | Robust Dai & Wigley 2000 (GRL) | Agrees — ETH JAS r=−0.63, SSD −0.59, SDN −0.40 |
| Horn of Africa East Africa | MAM “long rains” | weak / none | weak / none | Long rains only weakly tied to ENSO Wainwright et al. 2018 (Clim Dyn) | Agrees — little MAM ENSO signal in the Horn |
| Sahel & W. Africa Senegal, Mali, Niger, Chad, N. Nigeria gap vs NOAA/IRI | JJAS monsoon | drier | wetter | Direction robust; mechanism contested Dai & Wigley 2000 (GRL) | Agrees — SEN JJA −0.49, MLI JAS −0.41, TCD −0.43 |
| Middle East / Arabia SW Arabia / highland Yemen gap vs NOAA/IRI | JJA summer rains | drier (drought) | wetter | Single robust modelling+obs study; direct Pacific teleconnection Atif et al. 2017 (npj Clim Atmos Sci) | Agrees — YEM JAS r=−0.59 (summer); winter NDJ +0.53 |
| Middle East / Arabia Iraq, Iran, Levant, N. Arabia gap vs NOAA/IRI | SON–DJF autumn–winter | wetter | drier | Multiple studies; autumn phase-transition evidence Middle East autumn–ENSO study 2019 | Agrees — IRQ SON +0.63, IRN OND +0.59, SAU MAM +0.51 |
| South Asia India (all-India monsoon) | JJAS | drier | wetter | Robust historically but non-stationary (weakened since ~1980s) Indian-monsoon non-stationarity reviews | India is not in the ERA5 set (no admin-0 extract); the ENSO–monsoon link is documented but weakening |
| South Asia Pakistan, Afghanistan | OND & MAM (winter–spring) | wetter | drier | Established Dai & Wigley 2000 (GRL) | Agrees — PAK OND +0.55, MAM +0.54; AFG AMJ +0.59 |
| Central America Guatemala, Honduras, El Salvador, Nicaragua (Dry Corridor) | JJA–SON (incl. canícula) | drier (drought) | wetter | Canonical Dai & Wigley 2000 (GRL) | Agrees — GTM ASO −0.61, HND −0.60, NIC −0.61 |
| Southern Africa Zimbabwe, Zambia, Malawi, Mozambique, S. Africa, Botswana | DJF austral summer | drier (drought) | wetter | Robust, widely replicated Mason & Goddard 2001 (BAMS) | Agrees — ZWE DJF −0.68, ZAF NDJ −0.62, MOZ JFM −0.50 |
| SE Asia / Maritime Continent Indonesia, Philippines, Vietnam, Thailand | JJA–SON dry season | drier (drought) | wetter | Very robust (drought & fire risk) Dai & Wigley 2000 (GRL) | Agrees strongly — IDN ASO −0.87, PHL FMA −0.86, THA −0.81 |
Notes: directions are the dominant documented response — ENSO teleconnections are asymmetric, so the La Niña column is the typical (not guaranteed) opposite of El Niño. “Evidence” flags how well replicated each link is. The Yemen/SW-Arabia summer link is a direct Pacific teleconnection (Atif et al. 2017), not an Indian-Ocean-Dipole artefact. The ENSO–Indian-monsoon correlation is non-stationary and has weakened since the 1980s, consistent with the weak all-India signal in our ERA5 analysis. Framing on map incompleteness follows Lenssen, Goddard & Mason (2020), who detect many additional teleconnections when the standard maps are updated.
Every monitored country (153 ERA5-analysis countries), researched region by region from the literature. Cell shade encodes confidence (hatched/pale = single study, solid/dark = robust); the “La Niña” column shows the documented opposite where known (italic = inferred inverse). “—” = no robust documented ENSO rainfall link (grey on the map). Final column is this study's strongest significant ERA5 Niño3.4 correlation (season and sign), or “no sig”. Rows tagged gap are documented links absent/under-represented on the standard NOAA/IRI maps.
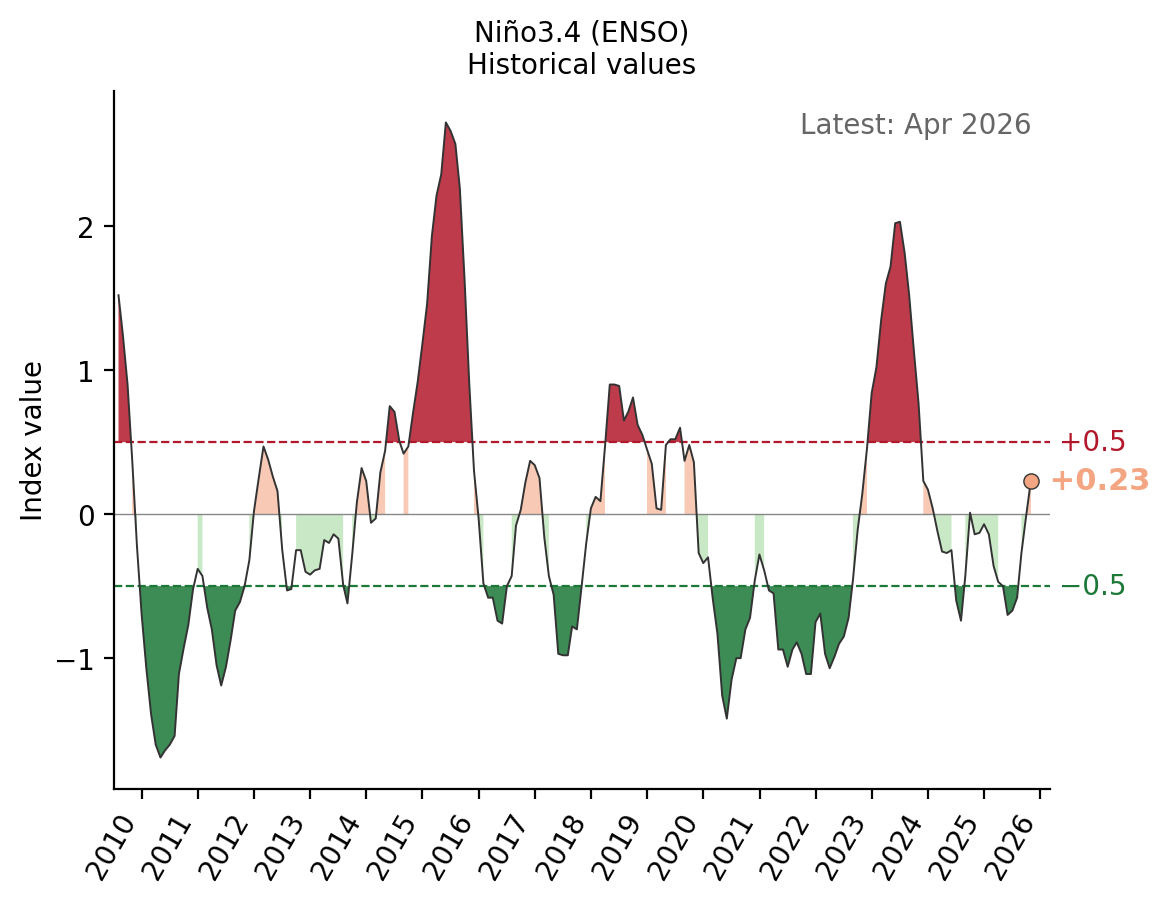
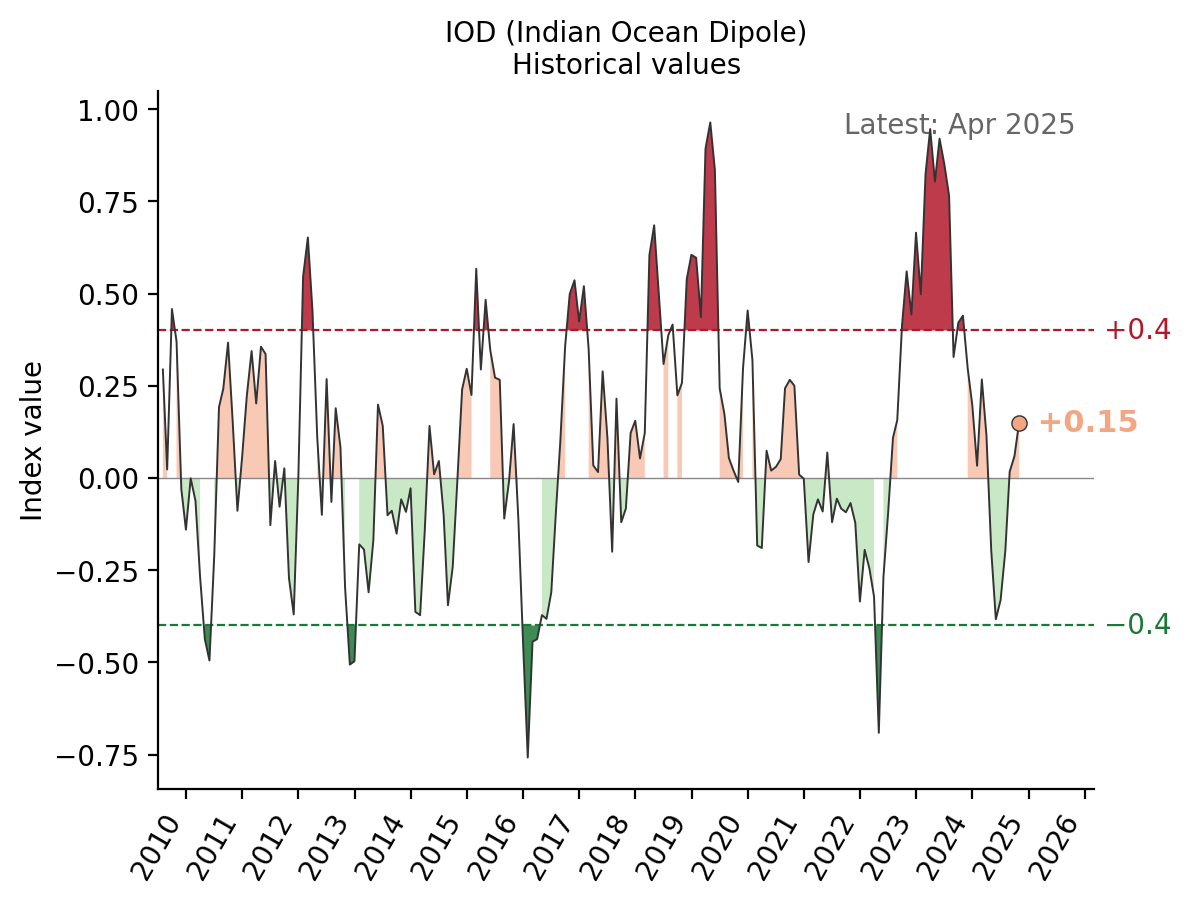
Rainfall is drawn from ERA5 reanalysis (ECMWF), extracted as country-level area-weighted mean precipitation for 153 countries at admin-0 level, covering 1981–2025. Units are mm/day; a trimester value is the mean of the three constituent monthly means (not a sum). Climate mode indices are monthly anomaly series downloaded from NOAA PSL: Niño3.4 (ERSSTv5 SST anomaly in 5°N–5°S, 120–170°W), IOD (Dipole Mode Index, HadISST), TNA (Tropical North Atlantic SST anomaly), TSA (Tropical South Atlantic SST anomaly), AMM (Atlantic Meridional Mode), and PDO (Pacific Decadal Oscillation, NOAA).
The Resolution toggle selects the unit of analysis; the method below is identical in both cases. Country (ADM0) uses the pre-computed ERA5 admin-0 raster statistics held in the team database — one area-weighted mean series per country, 153 countries. Pixel (0.25°) reads the source ERA5 monthly precipitation COGs directly and runs the whole pipeline independently on every land grid cell in the map viewport (~163,453 cells at 0.25°, ≈28 km at the equator), with no spatial smoothing or pooling between cells.
The pixel view exists because a national mean can hide as much as it shows: countries spanning more than one rainfall regime (Kenya, Ethiopia, Indonesia, Brazil) average opposing signals toward zero, and a signal confined to one basin or one side of a mountain range disappears entirely. It carries two costs. First, each cell is a single ~45-year series, so at p < 0.05 a few percent of cells will pass by chance; because no field-significance or false-discovery correction is applied, isolated coloured cells should be read as noise and only spatially coherent regions as signal. Second, an extra filter is needed that the country pass does not require: a cell–season is analysed only if its climatological mean exceeds 0.25 mm/day, which removes hyper-arid cells (Sahara, Rub' al Khali, Taklamakan interiors) where correlations against near-zero rainfall are numerically large but meaningless. Those cells are drawn in the “arid — no wet season” shade. Ocean cells are not analysed.
On the pixel maps, cells significant in both directions across non-overlapping seasons are hatched rather than split diagonally, and the coloured fill shows the stronger of the two. The pixel dominant-mode map shows the top mode only, and only where it leads the runner-up by at least 0.10 in |r| — one cell does not average enough area to make the arg-max over six collinear modes stable, so near-ties are left grey rather than assigned a winner.
All 12 rolling 3-month windows are assessed for every country: NDJ, DJF, JFM, FMA, MAM, AMJ, MJJ, JJA, JAS, ASO, SON, OND. Using rolling windows rather than four fixed seasons avoids misaligning the analysis window with the actual rainy season (e.g. a country whose rains peak Oct–Dec is better captured by OND than by JAS or DJF). Year labels use the first month of the window: NDJ and DJF are labeled by November and December respectively (e.g. DJF 2024 = Dec 2024–Feb 2025); all others by the year of their first month.
A country–trimester pair is included only if that trimester's climatological mean rainfall is at least 25% of the country's annual mean, suppressing correlations in dry seasons. Annual mean is computed from the four non-overlapping canonical trimesters (DJF + MAM + JAS + OND), which together cover each calendar month exactly once. Multiple rolling windows can qualify for the same country.
For each country × trimester × index combination, Pearson r is computed across all lags up to the selected maximum (index leading rainfall). The lag with the highest |r| is retained as the "best lag" for that combination. The Max lag toggle controls this cap: 3 months (default) restricts the index to at most one preceding non-overlapping season, which keeps the relationship within the same evolving event and is the more forecast-relevant view; 6 months additionally admits prior-season relationships (e.g. a previous winter's ENSO state predicting the following monsoon), which can have the opposite sign to the concurrent signal. Significance is assessed at p < 0.05 (two-tailed). Results below |r| = 0.3 are treated as no reliable signal and shown in gray; |r| ≥ 0.5 is shown in a darker shade. The best-lag values are frozen after the total pass and reused in the partial pass below.
On each per-index map, a country is shown in a single color if all its significant correlations for that index have the same sign. It is shown as a split diagonal if it has significant correlations in both directions across non-overlapping trimesters (e.g. ENSO drives wet conditions in one season and dry in another). With 12 rolling windows, the non-overlapping check is required to avoid pairing near-identical windows (e.g. JFM and FMA) as spuriously "bidirectional".
The unique-signal maps show partial correlations: the correlation between an index and rainfall after removing the linear influence of all other indices. This is implemented via the residuals method — for a given country, trimester, and target index, both the rainfall series and the target index series are separately regressed on all other indices (at their own frozen best lags), and the Pearson r of the residuals is taken as the partial correlation. PDO still has its own unique signal computed, but it is excluded from the control set — i.e. it is never regressed out of the other modes — because as a low-frequency mode strongly collinear with ENSO, controlling for it would absorb genuine ENSO signal. Best lags are identical to those from the total pass.
When an index is significant in the unique-signal view but not in the total view, this is a suppressor variable effect — the index has real predictive value that is masked in the raw correlation because it partially cancels shared variance from another index. These are shown in the unique-signal maps. The reverse — total significant, unique not — simply means the signal is largely shared with other modes.
El Niño and La Niña composites are computed per-country using the concurrent trimester's Niño3.4 value (not a single annual classification). For each country, the trimester with the strongest correlation to Niño3.4 is used as the headline season. Years in which the concurrent Niño3.4 mean ≥ +0.5 are composited as El Niño; years ≤ −0.5 as La Niña. Anomalies are expressed in standard deviations from the full-period climatological mean for that country–trimester. The two maps are independent — ENSO teleconnections are asymmetric and the La Niña composite is not simply the mirror image of El Niño.
The “Documented ENSO Impacts (Literature)” section complements the data-driven maps with teleconnections established in the scientific literature, which together are more complete than the generalized NOAA and IRI impact maps. It was assembled with a multi-agent deep-research pass: the question was decomposed into per-region search angles, parallel web searches retrieved candidate sources, and roughly two dozen peer-reviewed articles plus authoritative operational sources (NOAA, IRI, ICPAC/IGAD) were fetched and read. From these, falsifiable directional claims (region × season × phase × sign) were extracted and each was adversarially verified by an independent panel — a claim was retained only if it survived attempts to refute it, and dropped otherwise. This filtering removed plausible-but-unsupported statements; for example, the framing of the Yemen signal as Indian-Ocean-Dipole-mediated was refuted, so it is reported as a direct Pacific teleconnection (Atif et al. 2017). Coverage was then extended in a second region-by-region sweep over the rest of the monitored world (South America, the Caribbean, Central/East Africa, East Asia, the Pacific and the mid-latitudes), so that every one of the 153 monitored countries has been researched.
Verified regional findings were combined with canonical global ENSO-rainfall climatologies (Dai & Wigley 2000; Mason & Goddard 2001; Lenssen, Goddard & Mason 2020) into the per-link table. Each row carries a citation and an evidence-strength flag (robust and widely replicated vs. single-study or contested), and a “gap vs NOAA/IRI” tag where a well-supported link is absent or under-represented on the standard maps. Every documented link is cross-referenced against this study's own ERA5 correlation result (agree / partial / weak) as an independent check.
The map colors each country by its dominant documented El Niño response, labelled with the relevant 3-month season; countries that respond in opposite directions across seasons are shown split. Grey means a monitored country was researched but has no robust documented ENSO rainfall link; near-white means the country is not monitored and was not researched. The La Niña map is the mechanical inverse of El Niño — a first-order picture only, since ENSO is asymmetric. Evidence strength is uneven (robust in well-studied regions; single-study or contested elsewhere — see the per-country catalogue), and the “gap vs NOAA/IRI” tags are editorial judgements.