Global maps
Global teleconnection survey
Correlation of seasonal rainfall (ERA5, 1981–2025) with ENSO (Niño3.4), the Indian Ocean Dipole, the tropical Atlantic modes (TNA, TSA, AMM) and the PDO, across every rolling three-month season and lead times to six months. Country and pixel views, total and unique-signal correlations, ENSO composites, and a literature map of documented ENSO impacts for 153 monitored countries.
Per-index maps · Dominant mode · ENSO composites · Documented ENSO impacts (literature) · Methodology /survey/Moved here from /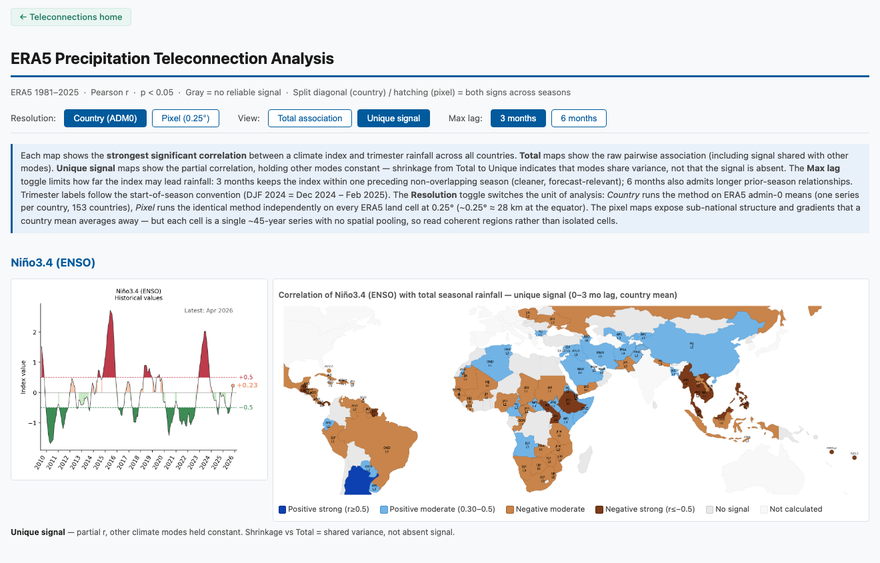
ENSO and seasonal rainfall, season by season
An interactive world map of how closely each three-month season’s rainfall has followed ENSO (Niño3.4), 1981–2025, for every 0.25° land cell. Pick a season, zoom anywhere (drag to turn the globe), and hover a cell for its correlation, the Niño3.4 lead and the season’s rainfall, with all twelve seasons for that place side by side. Same method as the survey’s pixel maps, extended to all land between 60°S and 84°N.
12 seasons · Classes or all values · Drier months on request · Zoom to a country · Shareable links /enso-map/Interactive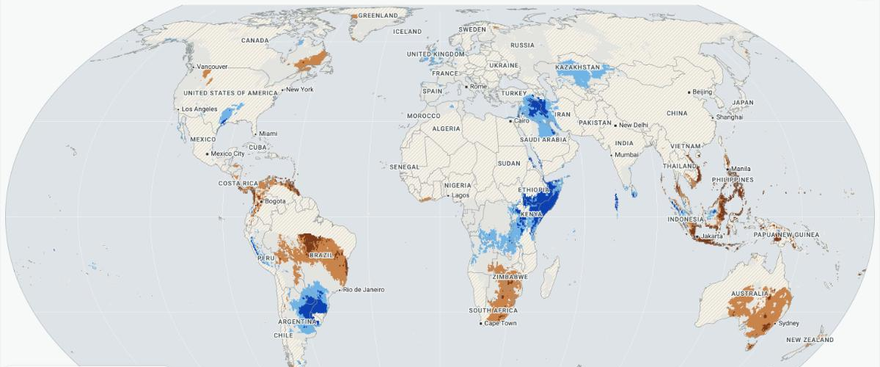
ENSO by country
ENSO country deep dives
Per-country reviews of the ENSO–rainfall evidence: why the survey catalogue grades a country as it does, what the peer-reviewed literature actually supports, what ERA5 shows at pixel resolution, and how much El Niño or La Niña shifts the odds of a drought season. Eritrea, Malawi and Zimbabwe so far.
/enso/ENSO & the seasonal forecast — slides for every country
Two slides per country from the SEAS5 alerts site: what generally happens during El Niño (the pixelwise ERA5 teleconnection, other climate modes held constant) and what the current SEAS5 issuance predicts, with skill shading. Country selector, English and French, PDF downloads.
seas5-skill/enso/External