10 How fusion and scoring work
10.0.1 Fusion’s probability
For each cell and day, fusion adds up evidence from the sources that observed it:
- a source saying flood raises the odds by its hit rate divided by its false-alarm rate, in that land type;
- a source saying dry lowers them by its miss rate (1 − hit rate) divided by its correct-dry rate (1 − false-alarm rate);
- couldn’t see adds nothing.
Odds, with an example. Odds are P / (1 − P); a probability of 0.002 is odds of about 1 to 500. In open land, in the first run, the base flood rate is 0.16%, and VIIRS’s hit rate is 0.66 with a false-alarm rate of 5.5%. One VIIRS flood report multiplies the odds by 0.66 / 0.055 = 12, which lifts P from 0.0016 to about 0.02. Reaching 0.5 takes several sources agreeing, or several days in a row.
Yesterday’s value carries over, fading 10% a day back towards the base flood rate for that land type. The base rate comes from the global random sample: how often GFM sees flood on an ordinary day. Fusion counts as flood when P ≥ 0.5. The hit and false-alarm rates are fitted only on the events in the other four folds (see Testing).
Fitting is counting. For each source and land type, two shares are counted on the events used for fitting:
- hit rate: of the gold-flooded cells the source observed, the share it called flood;
- false-alarm rate: of the gold-dry cells it observed, the share it called flood.
docs/methods.md calls these sensitivity and 1 − specificity. Half a hit is added to each count and one to each total, so no rate is ever exactly 0 or 1. The daily fading works on the log of the odds, not on P.
10.0.2 Scoring: one cell, one gold day, one count
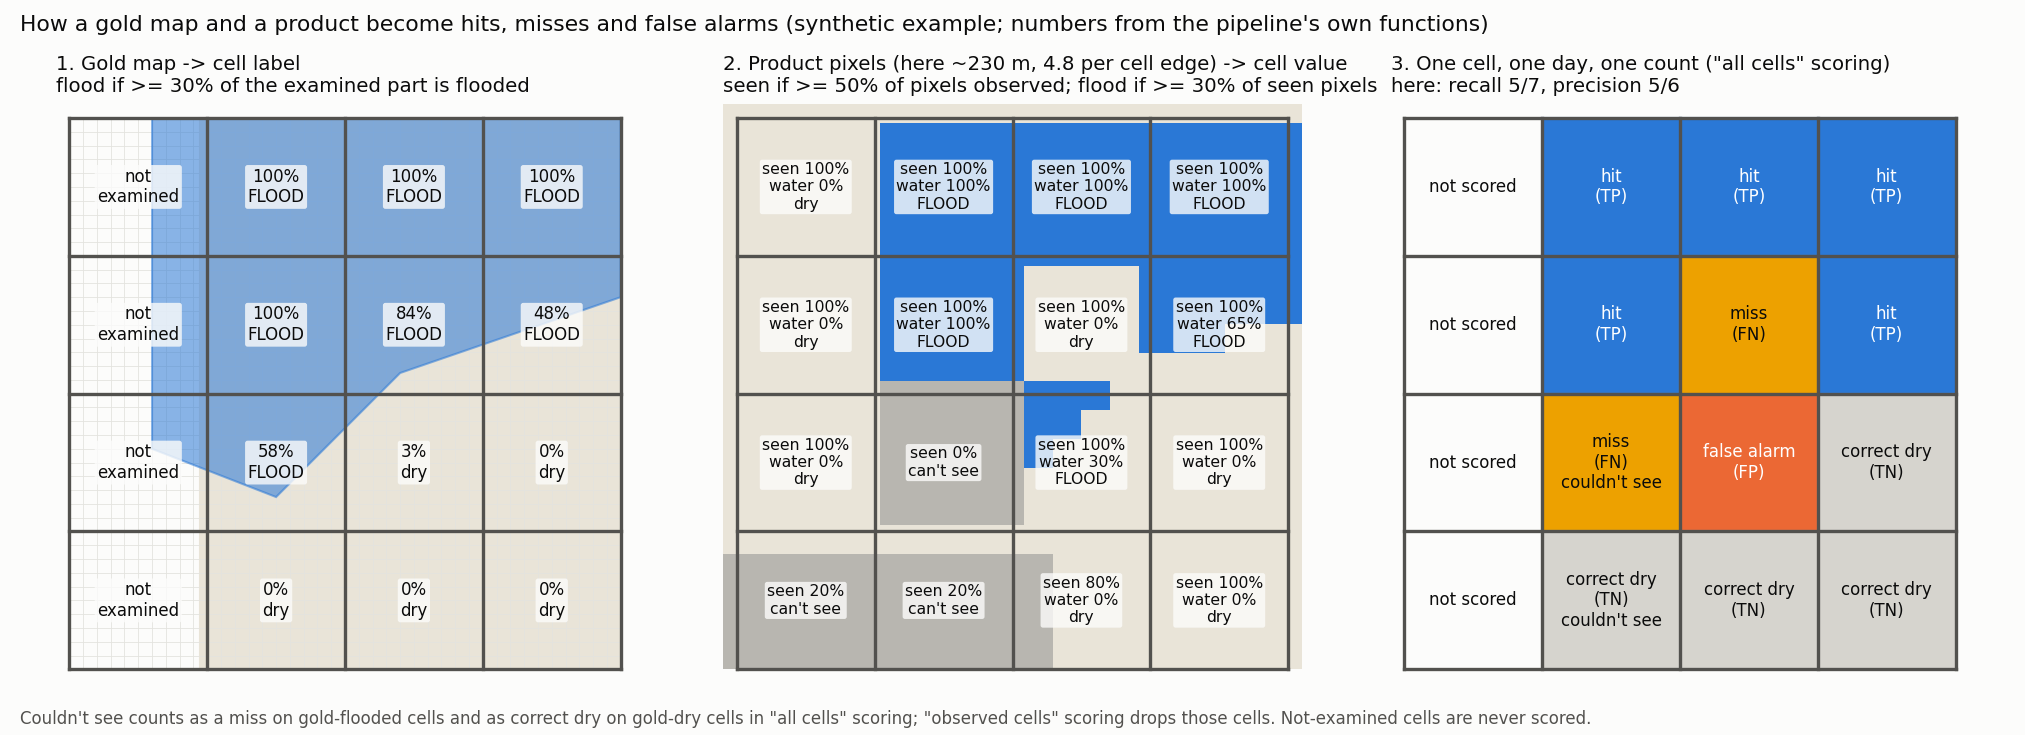
The figure uses a made-up gold map and product. The labels, values and counts in it come from the same code the pipeline runs. Flood drawn outside the examined area (the left column) is ignored. The product pixels here are about 230 m, but the rule is the same for any pixel size.
| gold: flooded | gold: dry | |
|---|---|---|
| product: flood | hit | false alarm |
| product: dry | miss | correct dry |
| product: couldn’t see | miss (all cells) / dropped (observed cells) | correct dry (all cells) / dropped (observed cells) |
- Recall = hits ÷ (hits + misses): the share of gold-flooded cells the product flags.
- Precision = hits ÷ (hits + false alarms): the share of its flood calls that gold confirms.
- F1 = 2 × hits ÷ (2 × hits + misses + false alarms): the balance of recall and precision, high only when both are. It is the headline single score.
- CSI = hits ÷ (hits + misses + false alarms): of all cells the product or gold calls flooded, the share where both do. It ranks products the same as F1 and appears only where criterion (b) needs it.
A worked example. One gold day, 100 labelled cells, 30 of them flooded. A product flags 25 cells, 20 of them among the 30 flooded. That is 20 hits, 5 false alarms, 10 misses and 65 correct dry: recall 0.67, precision 0.80, F1 0.73.
10.0.3 Two views, and how totals are formed
- All cells answers “what does a user get on a given day?”. A cell the product couldn’t see counts against it as a miss, which lowers recall but never precision.
- Observed cells answers “how good is the product when it looks?”. It scores only the cells a product saw, and fusion is scored on the same cells for a fair comparison.
- Totals are formed as described in From counts to totals: large floods weigh more, so every score is also reported per continent and per land type.
Precision here is measured inside mapped flood areas on flood days, where about a tenth of labelled cells on map days are flooded (12% in open land). On ordinary days far fewer are, so precision there is much lower. Measuring it needs non-event data: the global random sample, with GFM as stand-in truth. The event-level false-event check below covers part of this.