5 Events, days and how counts add up
Every score on this page is a sum of one kind of count: one labelled cell on one day. A window-day, used below, is one window on one day. Each event contributes three kinds of days, and only its map days are scored. The full list of events is in the Events tab.
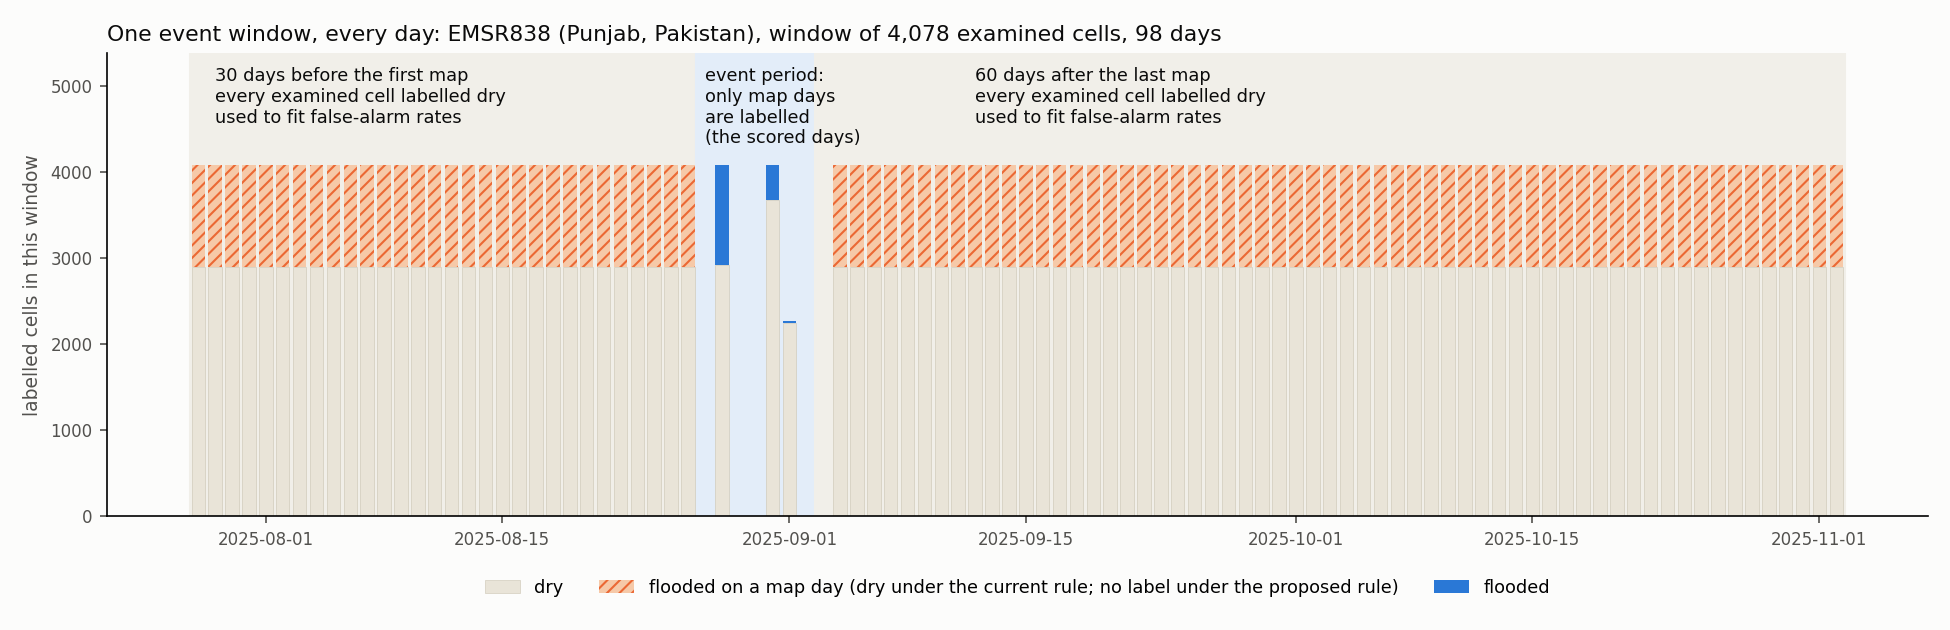
How to read it. One of the five windows of the Punjab floods (EMSR838). Each bar is one day; its height is the number of this window’s examined cells with a label that day.
- This is one of the event’s 5 windows. The event’s maps run from 27 August to 3 September 2025, so every window covers 28 July to 2 November: 98 days.
- This window has 3 of the event’s 7 map days: 28 and 31 August and 1 September. Only those days carry flood labels, and only they are scored. The bar on 1 September is shorter (2,265 cells) because that map examined fewer cells; a cell is labelled only where that day’s map examined it.
- Event-period days with no map for this window (27, 29 and 30 August, 2 and 3 September) have no bar: no cell is labelled.
- Every other day labels all 4,078 cells this window’s maps examined as dry. The hatched part, 1,176 cells, was flooded on at least one of the three map days (1,152 on 28 August alone). Under the adopted rule, those cells get no label on those days.
- The Events tab lists 46,191 cells for EMSR838: every cell in the rectangles of all 5 windows, examined or not.
| kind of day | which days | labels | used for | in the 170 events (floodable cells) |
|---|---|---|---|---|
| before | the 30 days before the event’s first map | every examined cell dry (except cells flooded on a map day in this window) | fitting false-alarm rates (every day); reliability | 11,280 window-days; 63.0 M dry cell-days |
| map days | days in the event period on which this window has a map | flooded, dry or none per cell (see Gold labels) | fitting hit and false-alarm rates; every recall, precision and F1 | 779 window-days; 404,014 flooded and 3,983,036 dry cell-days |
| between maps | days in the event period without a map for this window | none | not used | |
| after | the 60 days after the event’s last map | as before | as before | 22,560 window-days; 126.0 M dry cell-days |
The event period runs from the first to the last map across all the event’s windows. Each window is scored only on its own map days. The 170 events have 385 windows and 1,023 gold maps on 587 map days. 9 of the windows have no labelled cell at all, because their maps examined no floodable cell; the day counts above are for the other 376. Most events have one or two map days (55 and 35 events); the most is 19. A window covers at least 91 days; most cover 91–123 (median 98). One covers 824, because its activation was mapped repeatedly over months.