Appendix C — Wind Footprint over Population
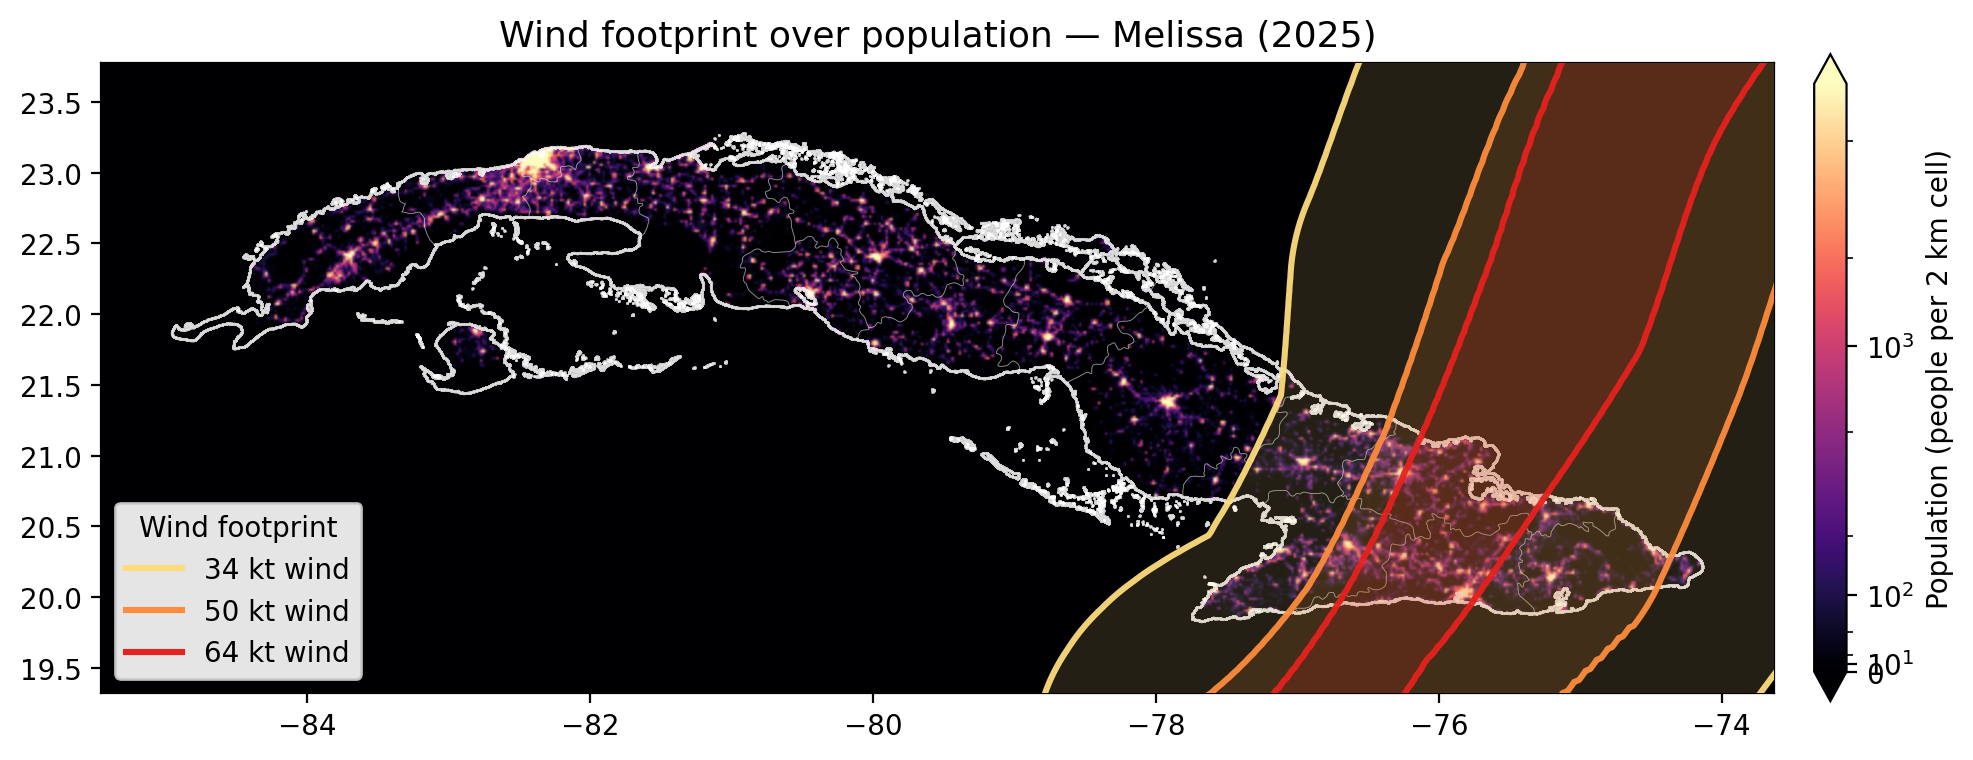
This appendix is a visual illustration of the idea behind the wind-based trigger: a storm’s wind-radii buffers are overlaid on the gridded population the framework uses to estimate exposure. It is not part of the calculation — it is a presentation aid that shows, for a single storm, how the wind footprint intersects where people actually live in Cuba.
The figure below is for Hurricane Melissa (2025). It is produced by the standalone script scripts/methodology_map.py (included in full at the end of this appendix) and stored as a PNG in blob storage, which we load directly here.
C.0.1 Figure
C.0.2 How it is built
- Wind buffers come from
storms.ibtracs_wind_buffers— the same IBTrACS wind-radii geometries used elsewhere in the analysis — drawn as the 34 / 50 / 64 kt rings, widest to tightest. - Population is the WorldPop 2026 1 km constrained raster (
worldpop/pop_count/global_pop_2026_CN_1km_R2025A_UA_v1.tif), windowed to Cuba, coarsened, and rendered on an asinh (“pseudo-log”) colour scale so that both the sparse rural land and the dense cities read clearly on the same map. - Boundaries are the CODAB admin-0 and admin-1 polygons.
The script renders any storm by friendly name (ike, gustav, irma, ian, oscar, melissa) or raw IBTrACS SID, and the --upload flag pushes the PNG to the blob location this page reads from. Its full source is included below for reference — it is displayed only, not executed when the book renders: