Results so far
Interim analysis outputs. Each figure and table is produced by a script in the repo; nothing here is a trigger yet.
Teso / Kyoga — what does GloFAS G5196 cover?#
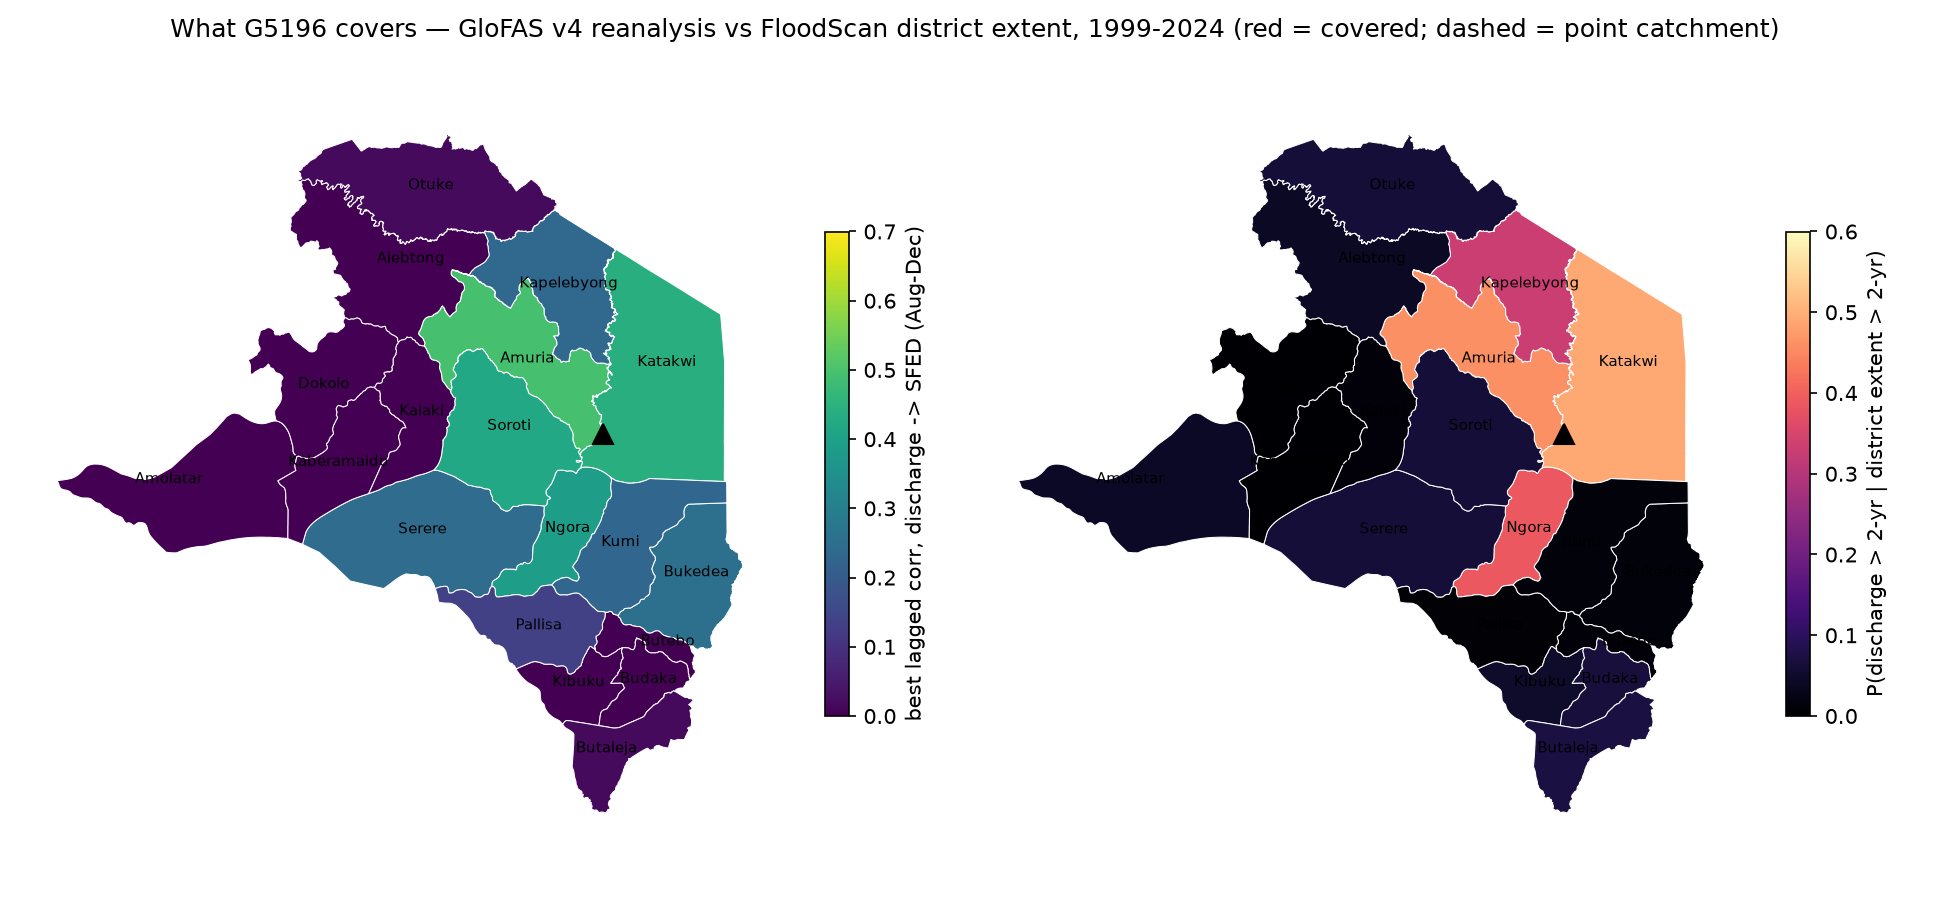
GloFAS v4 reanalysis discharge at the G5196 pixel against each candidate district's FloodScan flood-extent daily mean, 1999-2024: best lagged correlation of daily anomalies in the Aug–Dec flood season (the shared seasonal cycle removed), and the conditional probability that discharge is over its 2-year level when the district's extent (mean, or wettest pixel for small wetlands) is over its own 2-year level. Covered = anomaly correlation ≥ 0.45 and P ≥ 0.5 (red outline); dashed = the point's own catchment.
| district | membership | best lag (d) | best corr | P(Q>2yr | extent>2yr) | P(extent>2yr | Q>2yr) | covered |
|---|---|---|---|---|---|---|
| Amuria | core | 0 | 0.49 | 0.46 | 0.17 | False |
| Katakwi | core | 0 | 0.44 | 0.49 | 0.17 | False |
| Soroti | tier2 | 0 | 0.42 | 0.06 | 0.02 | False |
| Ngora | tier2 | 30 | 0.39 | 0.39 | 0.13 | False |
| Bukedea | excluded | 0 | 0.25 | 0.01 | 0.00 | False |
| Serere | tier2 | 28 | 0.24 | 0.06 | 0.03 | False |
| Kapelebyong | core | 0 | 0.23 | 0.33 | 0.06 | False |
| Kumi | excluded | 1 | 0.23 | 0.01 | 0.00 | False |
| Pallisa | excluded | 30 | 0.13 | 0.01 | 0.00 | False |
| Butaleja | excluded | 0 | 0.02 | 0.07 | 0.01 | False |
| Otuke | excluded | 0 | 0.02 | 0.06 | 0.01 | False |
| Dokolo | excluded | 0 | -0.01 | 0.00 | 0.00 | False |
| Kalaki | excluded | 0 | -0.01 | 0.01 | 0.00 | False |
| Budaka | excluded | 0 | -0.01 | 0.07 | 0.01 | False |
| Butebo | excluded | 30 | -0.02 | 0.01 | 0.00 | False |
| Amolatar | excluded | 0 | -0.03 | 0.04 | 0.01 | False |
| Kibuku | excluded | 5 | -0.03 | 0.05 | 0.01 | False |
| Kaberamaido | excluded | 0 | -0.03 | 0.00 | 0.00 | False |
| Alebtong | excluded | 0 | -0.03 | 0.04 | 0.01 | False |
Reading, and what it changed: the point speaks for Amuria and Katakwi at lag 0, and for Soroti, Ngora and Serere with a 19–30 day lag as the Awoja–Bisina wetlands fill; Kapelebyong holds the point and its headwaters (too little extent for a correlation, but its rare floods coincide with high discharge). Nothing further out passes: Kumi, Bukedea, Pallisa, Butaleja and the Mpologoma districts, and the whole Kyoga north shore (Kaberamaido, Kalaki, Amolatar, Dokolo, Otuke, Alebtong) have weak correlations and no threshold agreement. The zone was redrawn accordingly: three core districts plus a downstream-wetland tier.
The caveat that matters most — the relationship is not stable in time. Now that the reanalysis covers 1999–2024, splitting by era shows the Katakwi correlation running 0.25 (1999–2005), 0.83 (2006–2011), 0.57 (2012–13), 0.15 (2014–19) and 0.06 (2020–24), with every other district in the zone swinging the same way. The full-record figure is therefore an average over periods that behave very differently, and the recent decade — the one that matters operationally — is the weakest. Two direct contradictions: 2020 is the model's record year (125 m³/s, three times its 2-year level) while the satellite saw an ordinary season, and 2022 is Amuria's wettest year in the satellite record on near-minimum discharge. Modelled daily variability also rises steadily across the eras (standard deviation 5.2 → 17.3 m³/s) with no matching change in the satellite, which points at the model rather than the river. Before this point carries an action trigger it needs a third opinion independent of both — the Directorate of Water Resources Management gauge record if it can be obtained, or Google Flood Hub — and the backtest must be reported era by era rather than as a single number.
Adjumani / Albert Nile — are the floods lake-level events?#
Monthly altimetry levels of Lakes Victoria, Kyoga and Albert (NASA Global Water Monitor) against every dated flood record we hold for Adjumani, Moyo, Obongi, Nebbi and Pakwach (DesInventar datacards 1992–2021, EM-DAT, and curated 2019–2024 events).
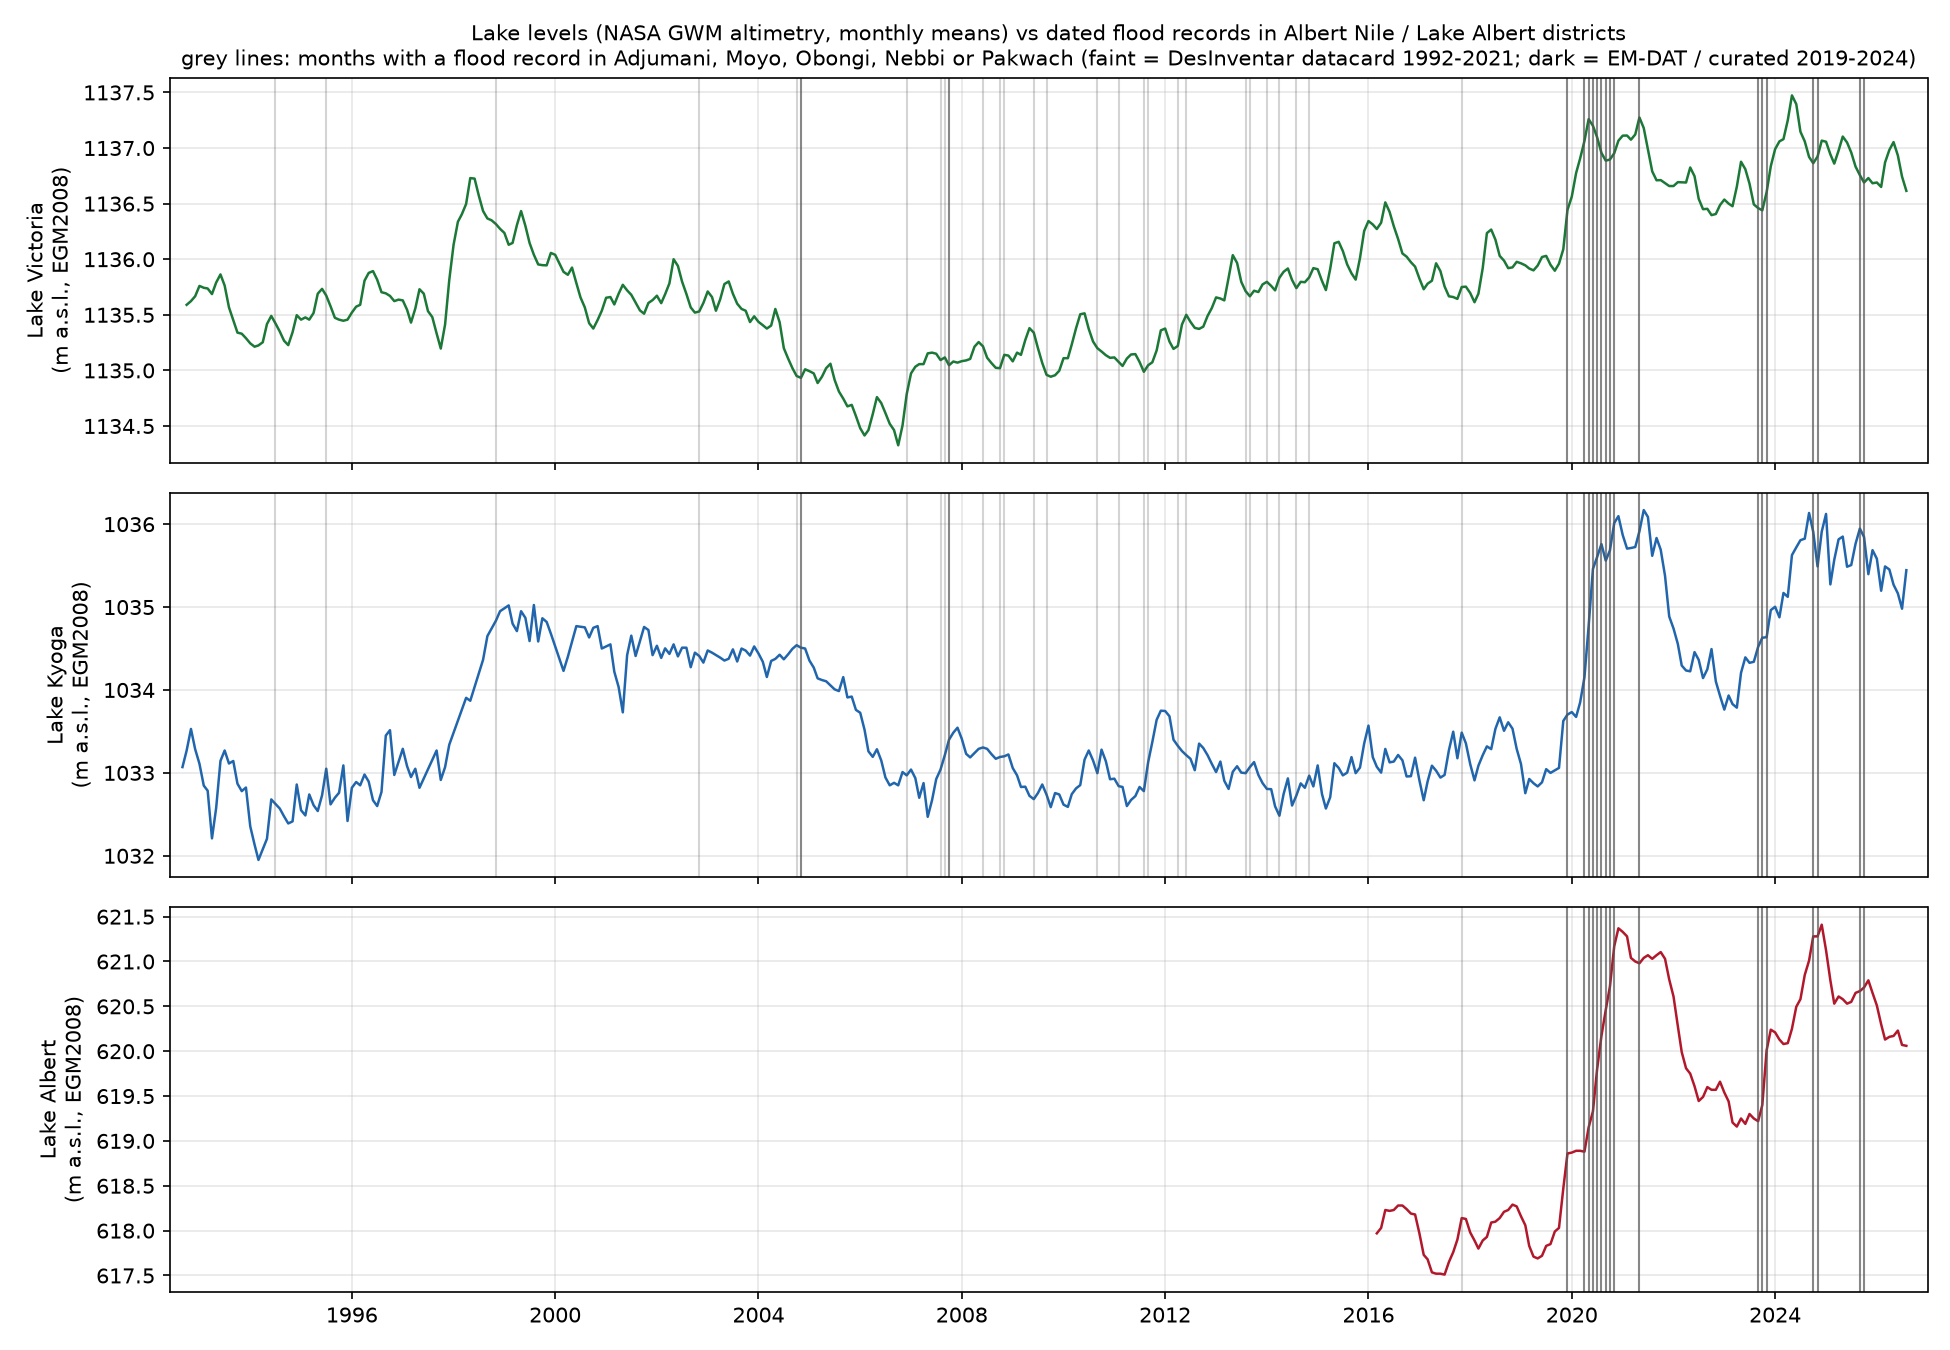
Reading: two regimes. The large, well-documented backwater floods (Pakwach and Obongi 2020, 2021, Obongi/Palorinya Oct–Nov 2024) sit above the 90th percentile of Kyoga and Albert levels, with the Victoria → Kyoga → Albert chain giving months of lead. Most smaller DesInventar records (Moyo 2008, 2011, 2014; Nebbi 2007–2014) occurred at ordinary lake levels and are local-rain / tributary events. The zone therefore needs a lake-level leg and a rainfall leg.
Mount Elgon and Karamoja — how much rain falls before the recorded events?#
Link 2 of the flash-flood chain (observed rain → impact), on IMERG daily rainfall averaged over each zone's core districts, 1998–2026: for every day-dated impact record in the zone (DesInventar datacards, EM-DAT, curated events) the 3-day rainfall in the three days before the event, as a percentile of all days.
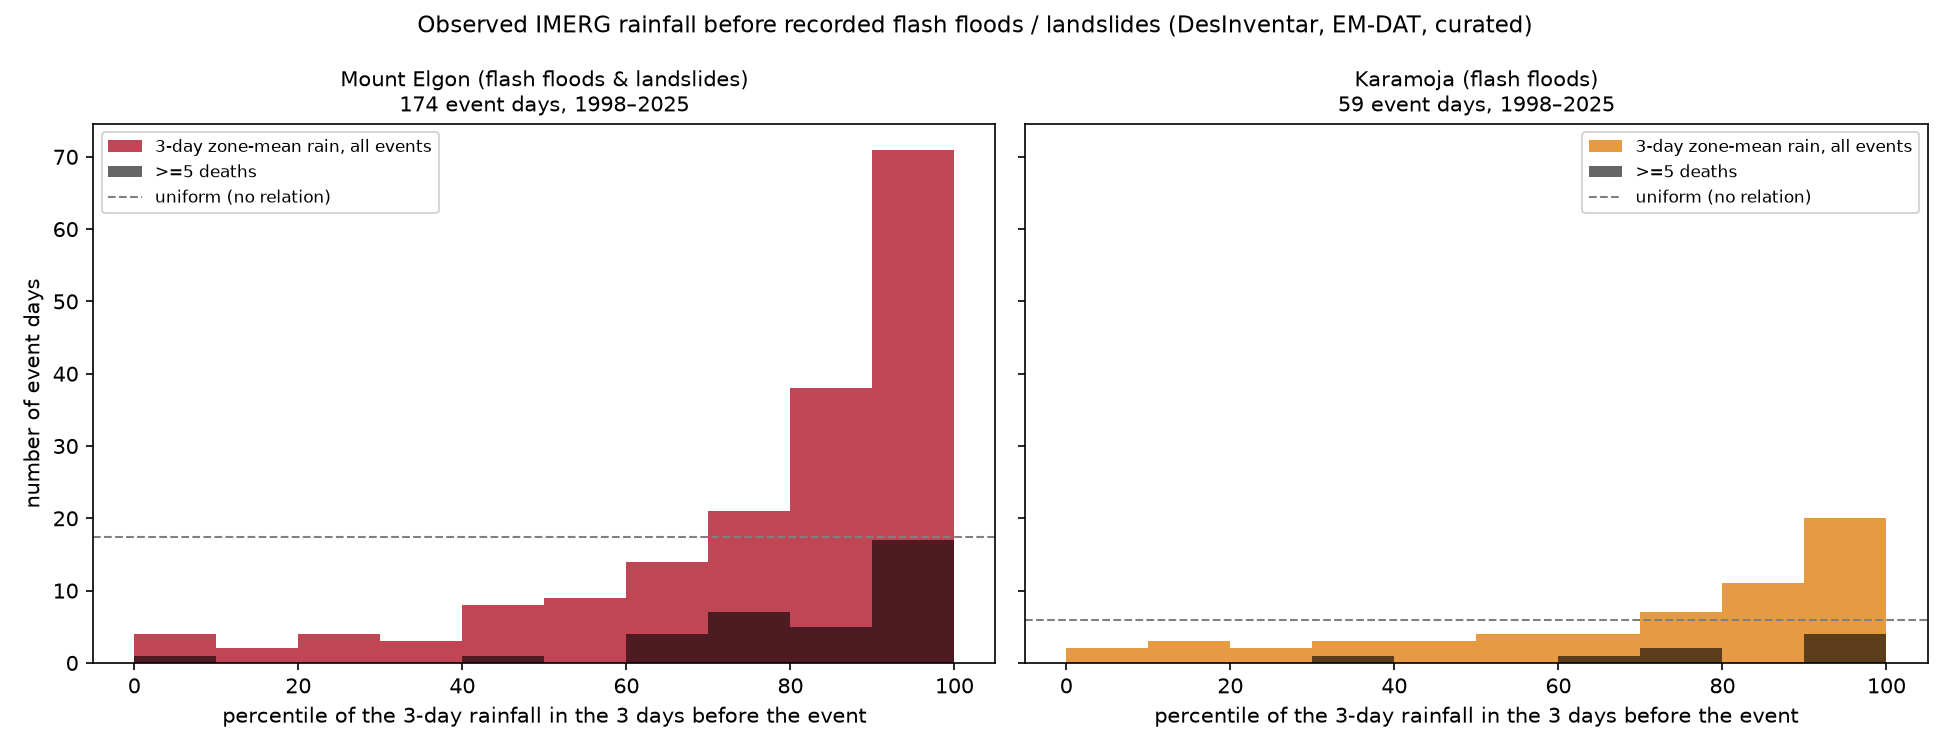
Reading: events do happen on wet days — the median pre-event 3-day rainfall sits at the 86th percentile on Elgon and the 83rd in Karamoja, and the deadly events (≥5 deaths) at the 88th — but almost never on extreme days: only 2 % of events follow 3-day zone-mean rainfall above its 2-year level, and of the 17 zone-wide episodes above that level since 1998 only one coincided with a recorded event. A zone-mean rainfall return-period threshold of the usual kind would therefore miss nearly everything and mostly activate on non-events. The trigger needs a lower rainfall bar combined with antecedent wetness (the landslide literature's 'prolonged low-intensity rain'), finer spatial resolution (district or slope-unit rather than zone mean), and an explicit statement of the false-alarm ratio that comes with it. The forecast leg (CHIRPS-GEFS vs IMERG) follows when its table lands.
Does antecedent wetness help?#
Soil moisture is the missing variable in the previous result: landslides and flash floods follow moderate rain on saturated ground. Until the ERA5-Land soil-moisture download lands, an antecedent precipitation index from IMERG stands in for it (APIt = 0.9·APIt−1 + Pt, an e-folding time of about ten days, lagged so it describes the ground before the 3-day rain window). Grey: all days since 1998; points: event days; circles: events with five or more deaths.
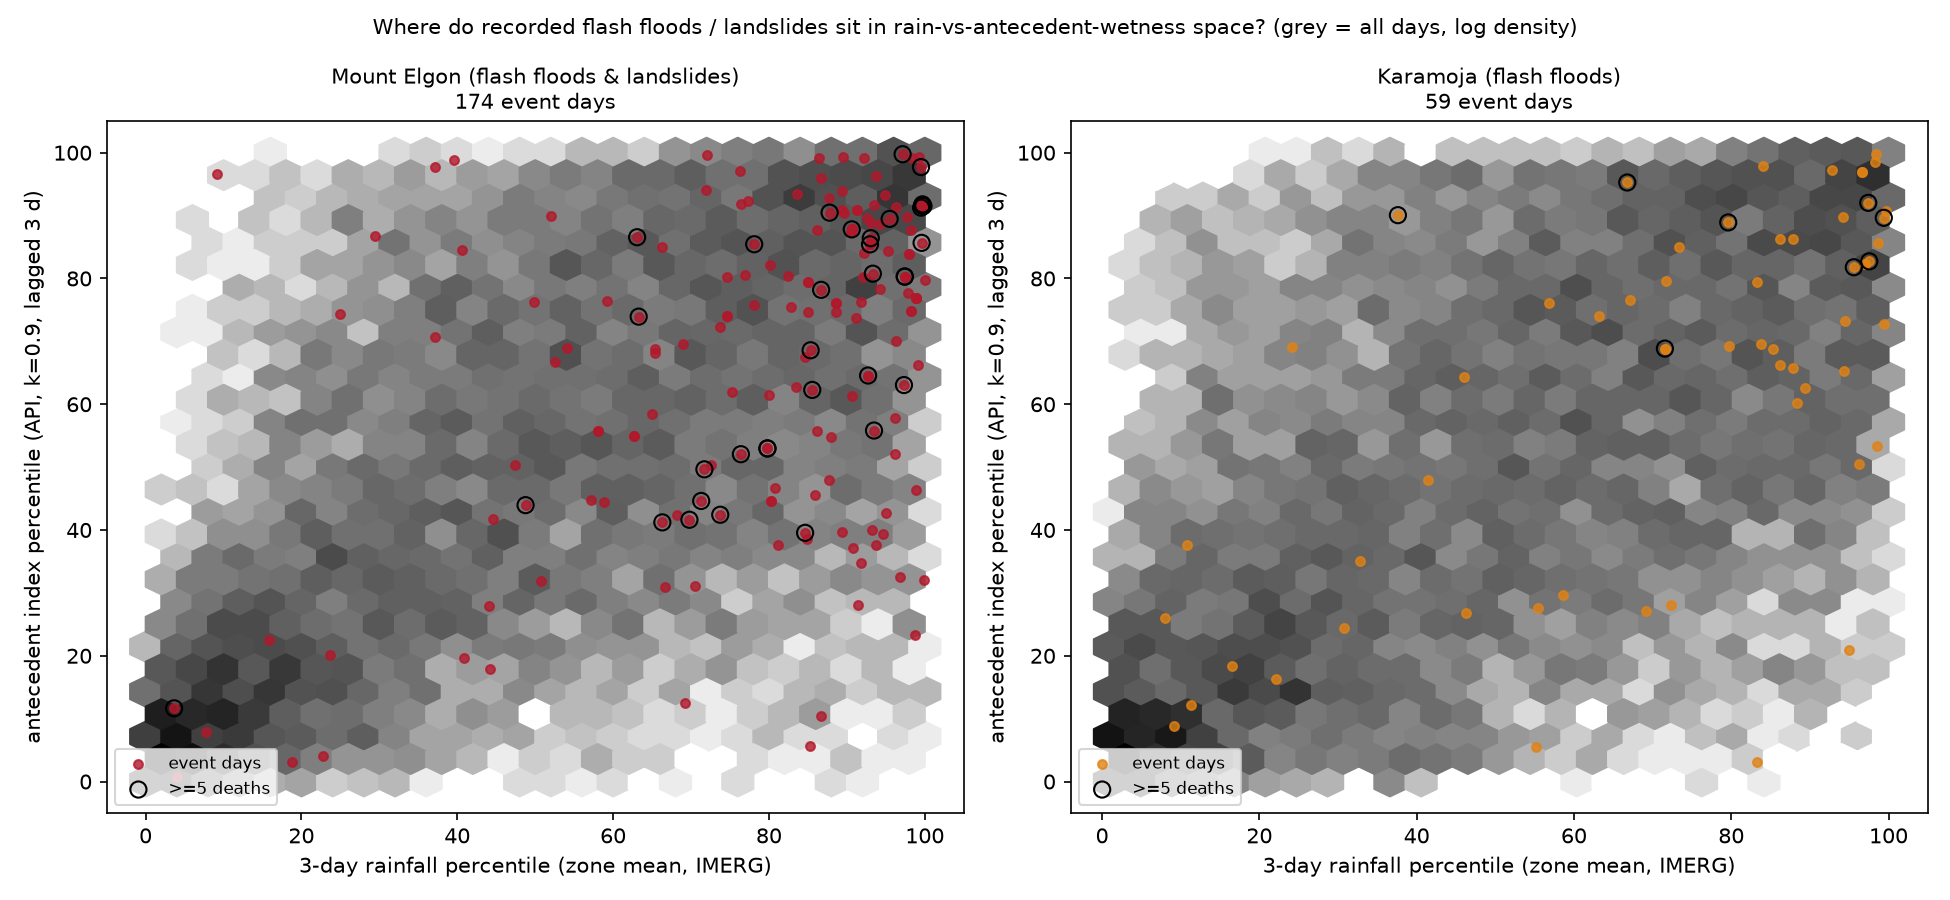
Reading: events cluster in the wet–wet corner, and the deadly ones more so (median antecedent percentile 78 on Elgon, 89 in Karamoja). A trigger grid over rain and antecedent thresholds (tables outputs/flash_trigger_grid_*.csv, zone-level and any-district variants) shows what that buys: at a fixed rain threshold, requiring the antecedent index above its 85th percentile roughly doubles the share of activations that have a recorded event within two days (for example on Elgon, any-district 3-day rain ≥ 95th percentile: 8 % → 14 %), while keeping about half of the deadly events. But no combination gets precision above about 15 %, and catching most deadly events costs 10–25 activations a year. Two things follow. First, a daily rainfall trigger at zone scale is a readiness-tier signal at best, not an action trigger; the action decision needs something sharper — slope-unit susceptibility, a landslide-model layer, community gauges, or the forecast's own probability. Second, the impact record is incomplete (DesInventar stops in 2021 and misses minor events), so true precision is somewhat higher than measured — but not by the factor needed. ERA5-Land soil moisture will replace the proxy and be re-tested here.
Where impact has been recorded#
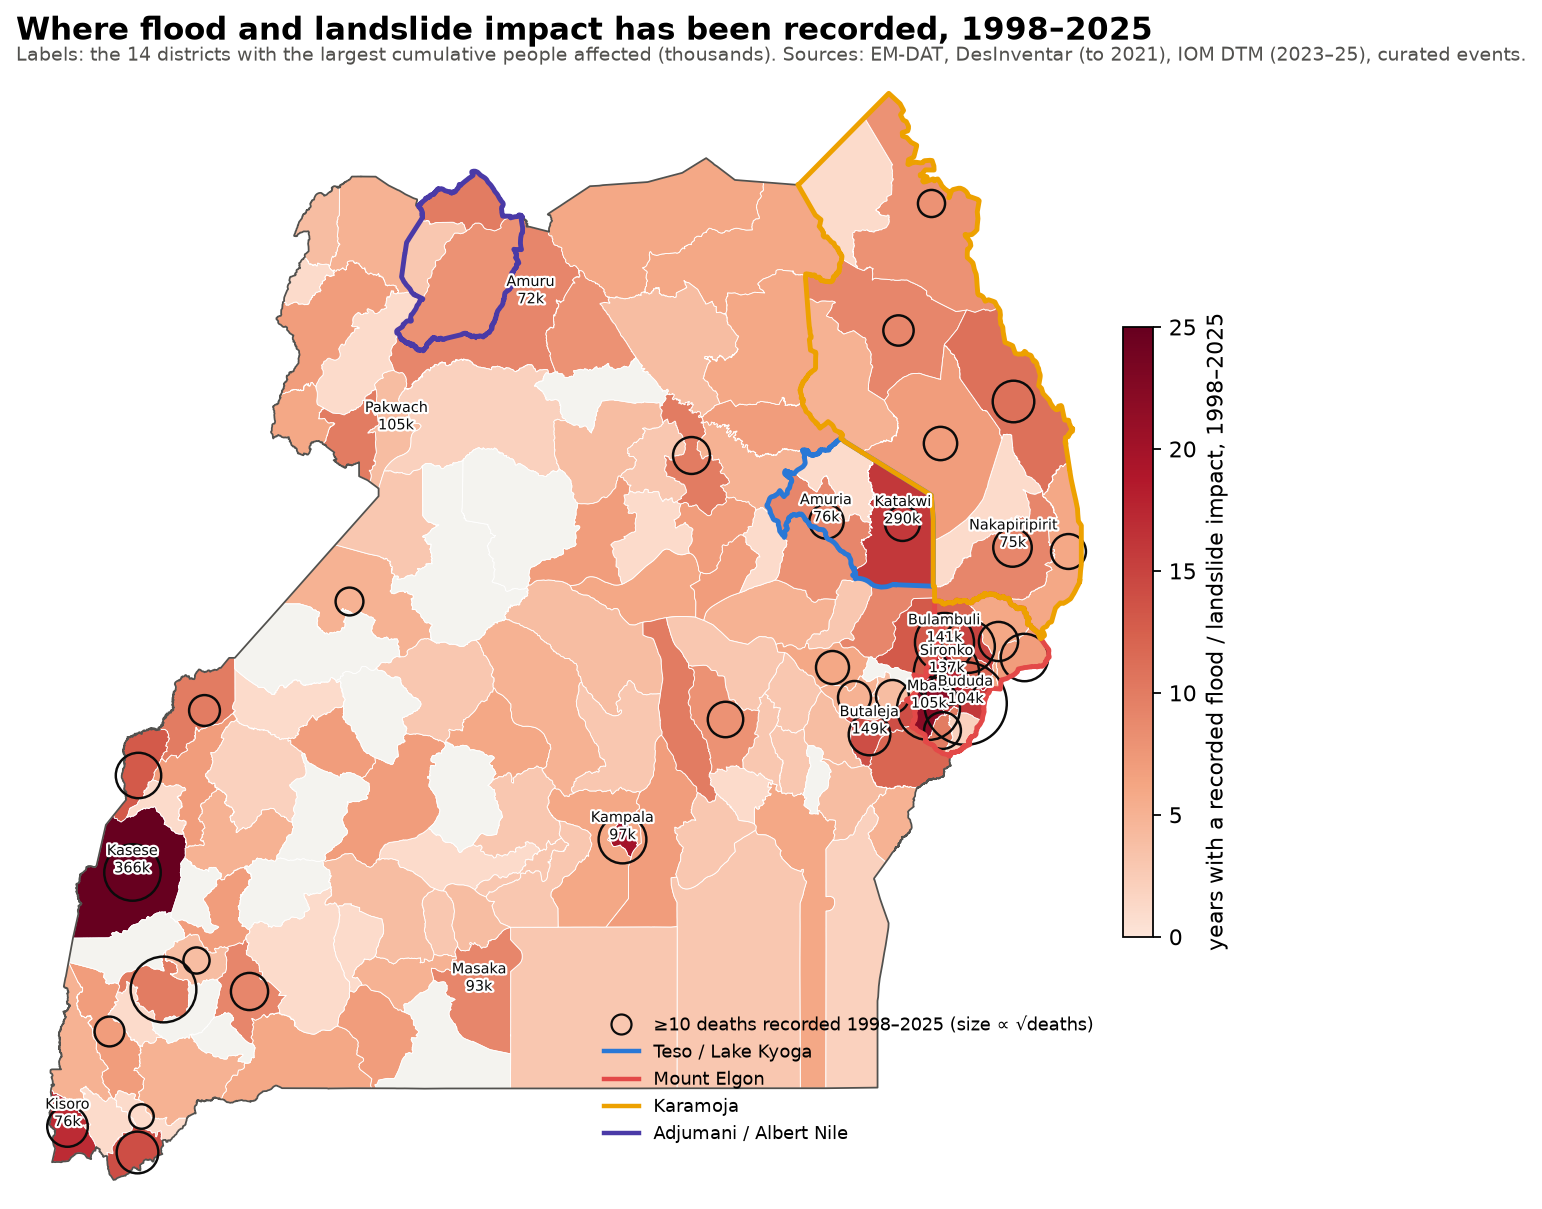
All four impact sources merged to district-years (EM-DAT, DesInventar to 2021, IOM DTM 2023–25, curated events). First the whole record on one map: how many years each district has a recorded flood or landslide impact, cumulative deaths as circles, the 14 largest cumulative caseloads labelled, and the zones outlined.
Then one map per year. Districts are coloured by people affected that year (log scale; pale pink = a record without a count), circles mark five or more deaths. Panels are framed for El Niño Oct–Dec seasons (orange, ONI ≥ 0.5), with a tag for positive-IOD seasons. The 2007 Teso floods, the 2010 to 2013 run, 2018, 2020 and the 2024 to 2025 El Niño years stand out; 2019 and 2022 are under-recorded because DesInventar has no 2019 cards and stops in 2021.
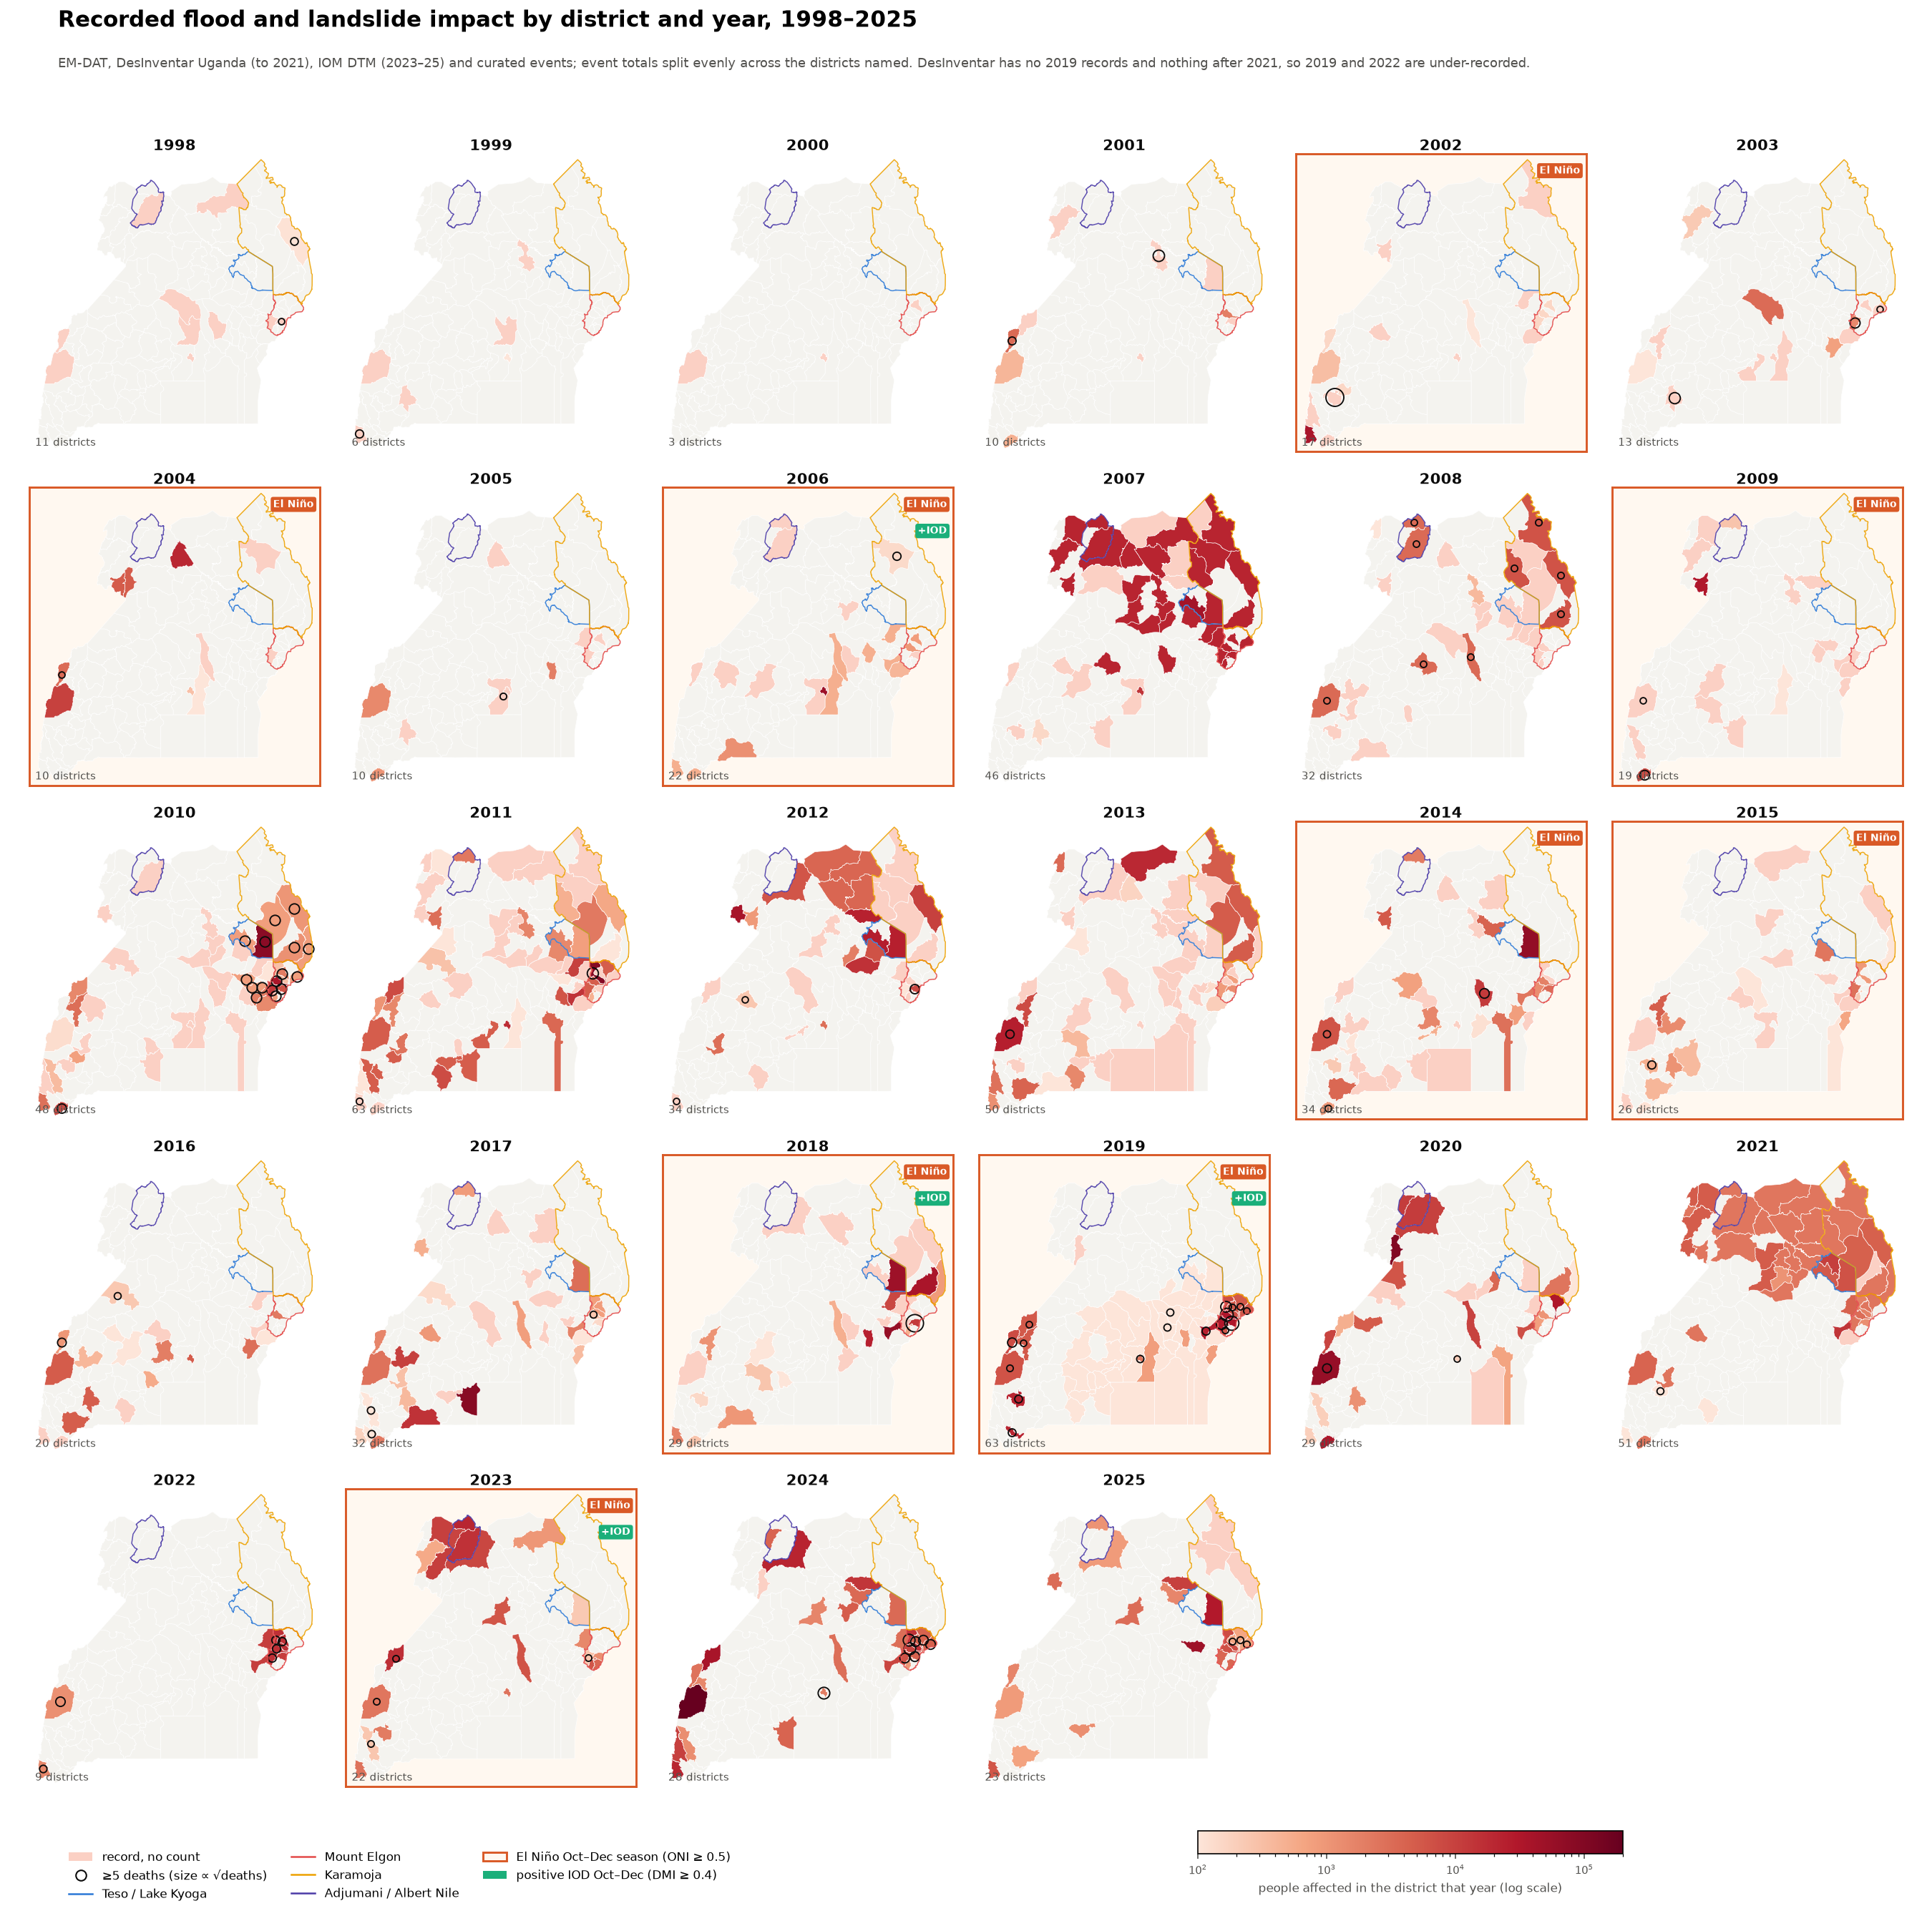
Two corrections to the raw sources: a few DesInventar datacards carry national totals against one district (Agago 3,000,000 in July 2007; Bududa 300,000 in March 2010 against EM-DAT's 12,795), so counts of 100,000 or more per card are dropped while the record is kept; and DesInventar double-counts deaths across cards, so EM-DAT or curated death tolls take precedence where they exist. Table: outputs/impact_district_year.csv.
Does FloodScan see the recorded impact?#
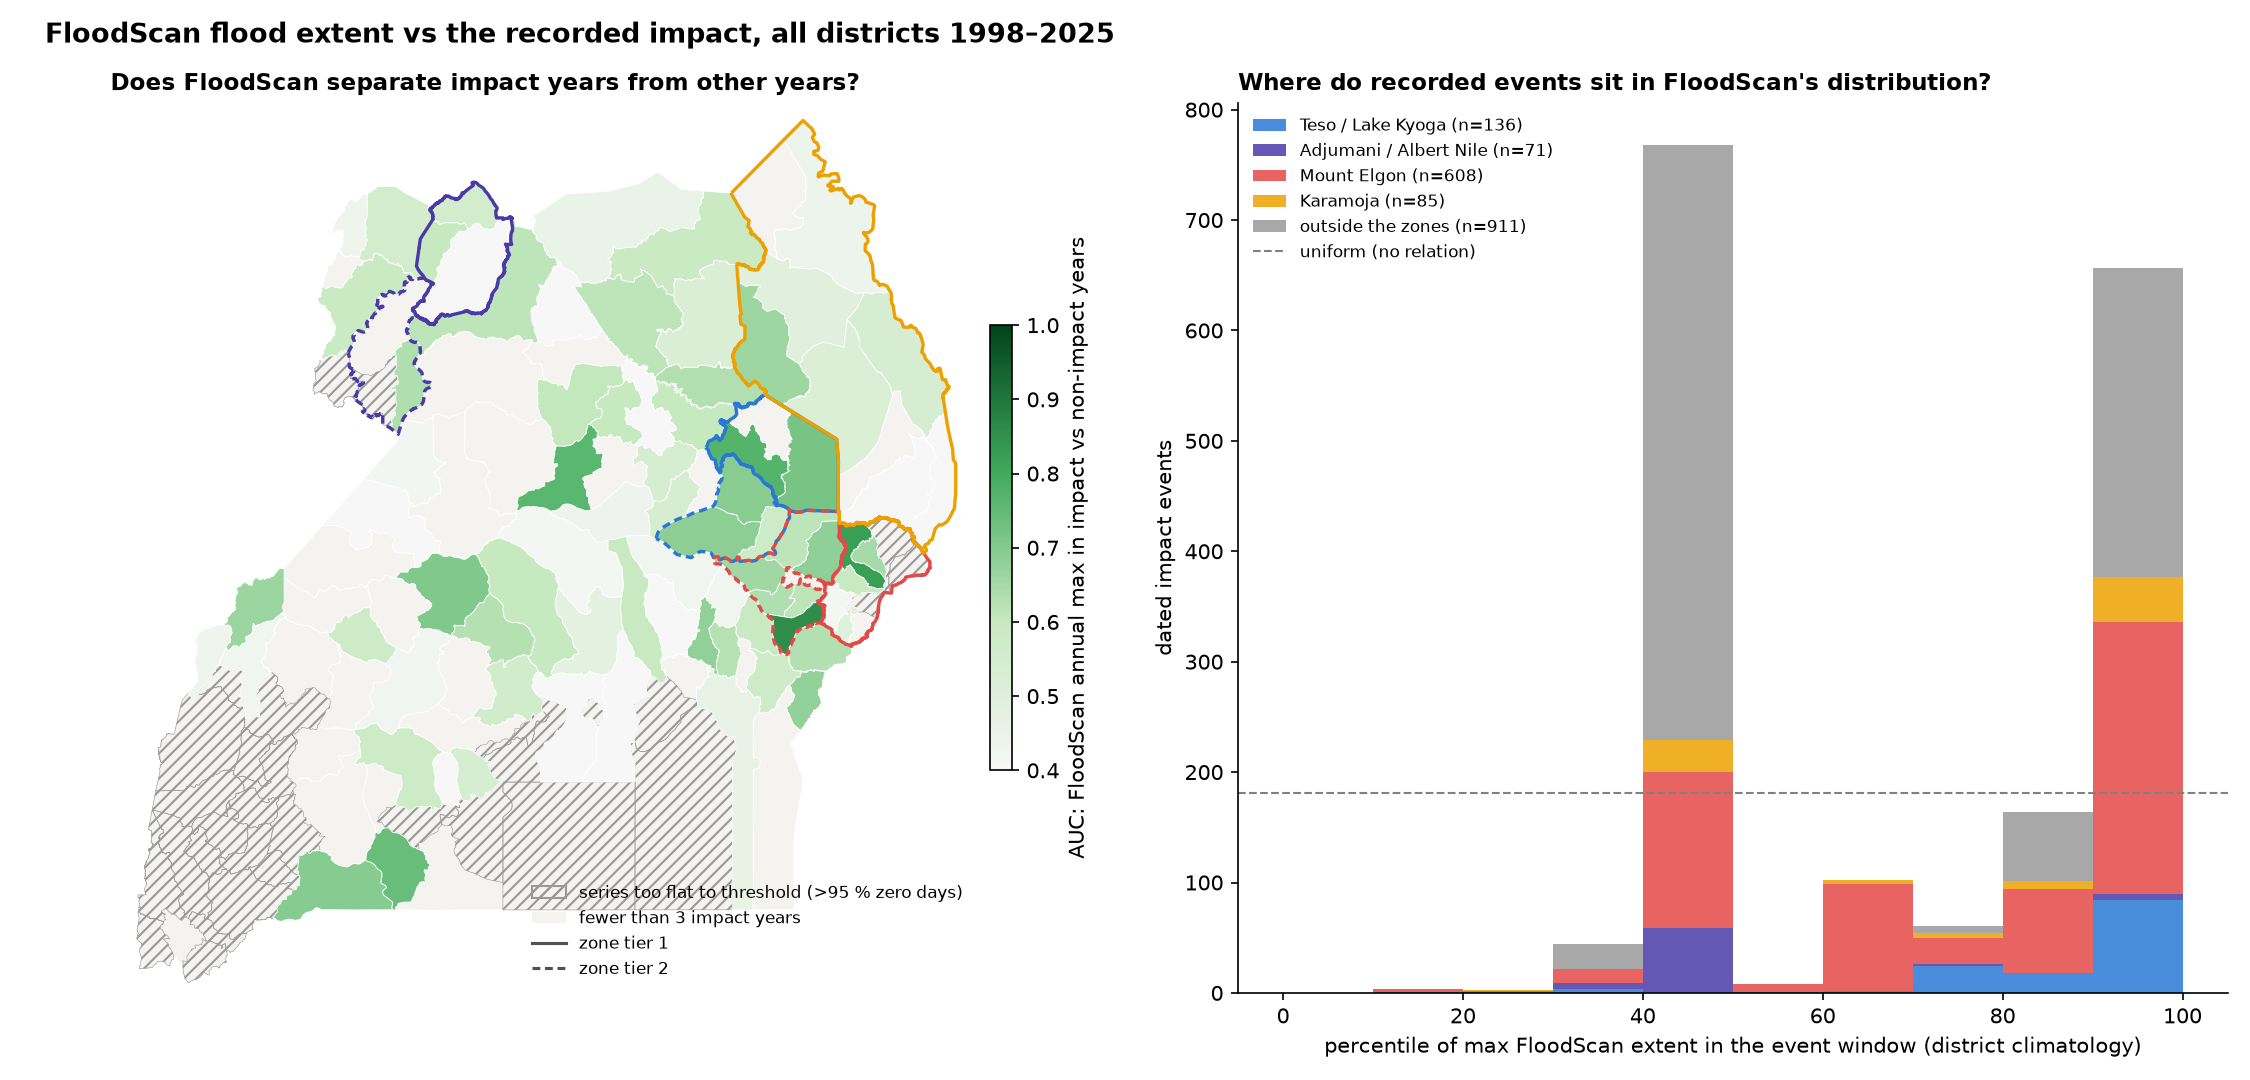
The observational backstop leans on FloodScan, so this asks, district by district, whether the satellite registers the floods people actually reported. Everything here is rank-based, because an operational threshold would be a percentile or return period of the district’s own record rather than an absolute extent — a district where FloodScan only ever reaches half a percent is perfectly usable if those small peaks land on the days people flooded. Two tests: at year level the AUC, the probability that a random impact year has a higher annual maximum than a random non-impact year; and at event level whether each dated event reaches the district’s own top fifth of days. The comparison for that second test is not one in five: each event is judged on the highest day in an 11-day window around it, and the highest of 11 days is naturally high, so the page measures, district by district, how often an arbitrary window in the record reaches the top fifth — anywhere from 1 % to 65 %, median 36 %, depending on how persistent the series is. A district counts as usable when its events reach the top fifth at least 10 points more often than arbitrary windows do, on at least three dated events, and its series is not so flat (over 95 % exactly-zero days) that there is nothing to threshold.
An earlier version of this page gated on absolute extent — a 2-year level under 1 % was called ‘blind’ — and wrongly wrote off districts whose relative signal is fine. Kapchorwa, Manafwa, Mbale and most of Karamoja were casualties of that error. A second correction followed: the event test was first compared with a fixed one-in-five chance rate, which flattered Budaka, Kumi, Kaabong and Napak. The numbers below use the measured, per-district chance rate.
| area | districts | usable | dated events | median percentile at events | events in the top fifth | arbitrary windows (chance) | median AUC |
|---|---|---|---|---|---|---|---|
| Teso / Lake Kyoga — tier 1 | 3 | 3 of 3 | 114 | 94 | 75% | 42% | 0.72 |
| Teso / Lake Kyoga — tier 2 (downstream wetlands) | 3 | 2 of 3 | 22 | 89 | 73% | 36% | 0.69 |
| Mount Elgon — tier 1 | 9 | 4 of 9 | 468 | 68 | 48% | 22% | 0.46 |
| Mount Elgon — tier 2 (lowlands below the massif) | 6 | 4 of 6 | 140 | 92 | 71% | 41% | 0.65 |
| Karamoja — tier 1 | 9 | 5 of 9 | 85 | 90 | 56% | 43% | 0.44 |
| Adjumani / Albert Nile — tier 1 | 3 | 0 of 3 | 33 | 43 | 3% | 29% | 0.56 |
| Adjumani / Albert Nile — tier 2 (Lake Albert shore and upper Albert Nile) | 3 | 0 of 3 | 38 | 48 | 13% | 29% | 0.64 |
| outside the zones | 99 | 27 of 99 | 911 | 48 | 38% | 32% | 0.52 |
Reading: the satellite is a good witness across both Teso tiers: 79 % and 68 % of events reach the district’s top fifth, against 42 % and 36 % of arbitrary windows, and all six districts are usable. In the Elgon lowlands four of six are usable (Bukedea, Butaleja, Kibuku, Pallisa); Budaka and Kumi sit at chance. On the Elgon slopes it is mixed rather than absent: Bulambuli, Kapchorwa, Manafwa and Mbale are usable, Bududa, Bukwo and Kween have series that are essentially always zero, Sironko’s floods do not land high in its own record, and Namisindwa has a single dated event. Karamoja is weaker than the first rank-based pass suggested: four of nine districts are usable (Abim, Amudat, Kotido, Nakapiripirit), and across the zone events beat chance only narrowly, 50 % against 43 %. Adjumani is the one clear failure: 3 % and 10 % of events reach the top fifth, below the 29 % an arbitrary window manages, so the Albert Nile really is invisible and the backstop there has to be a river gauge or reports.
Exposure, not just extent#
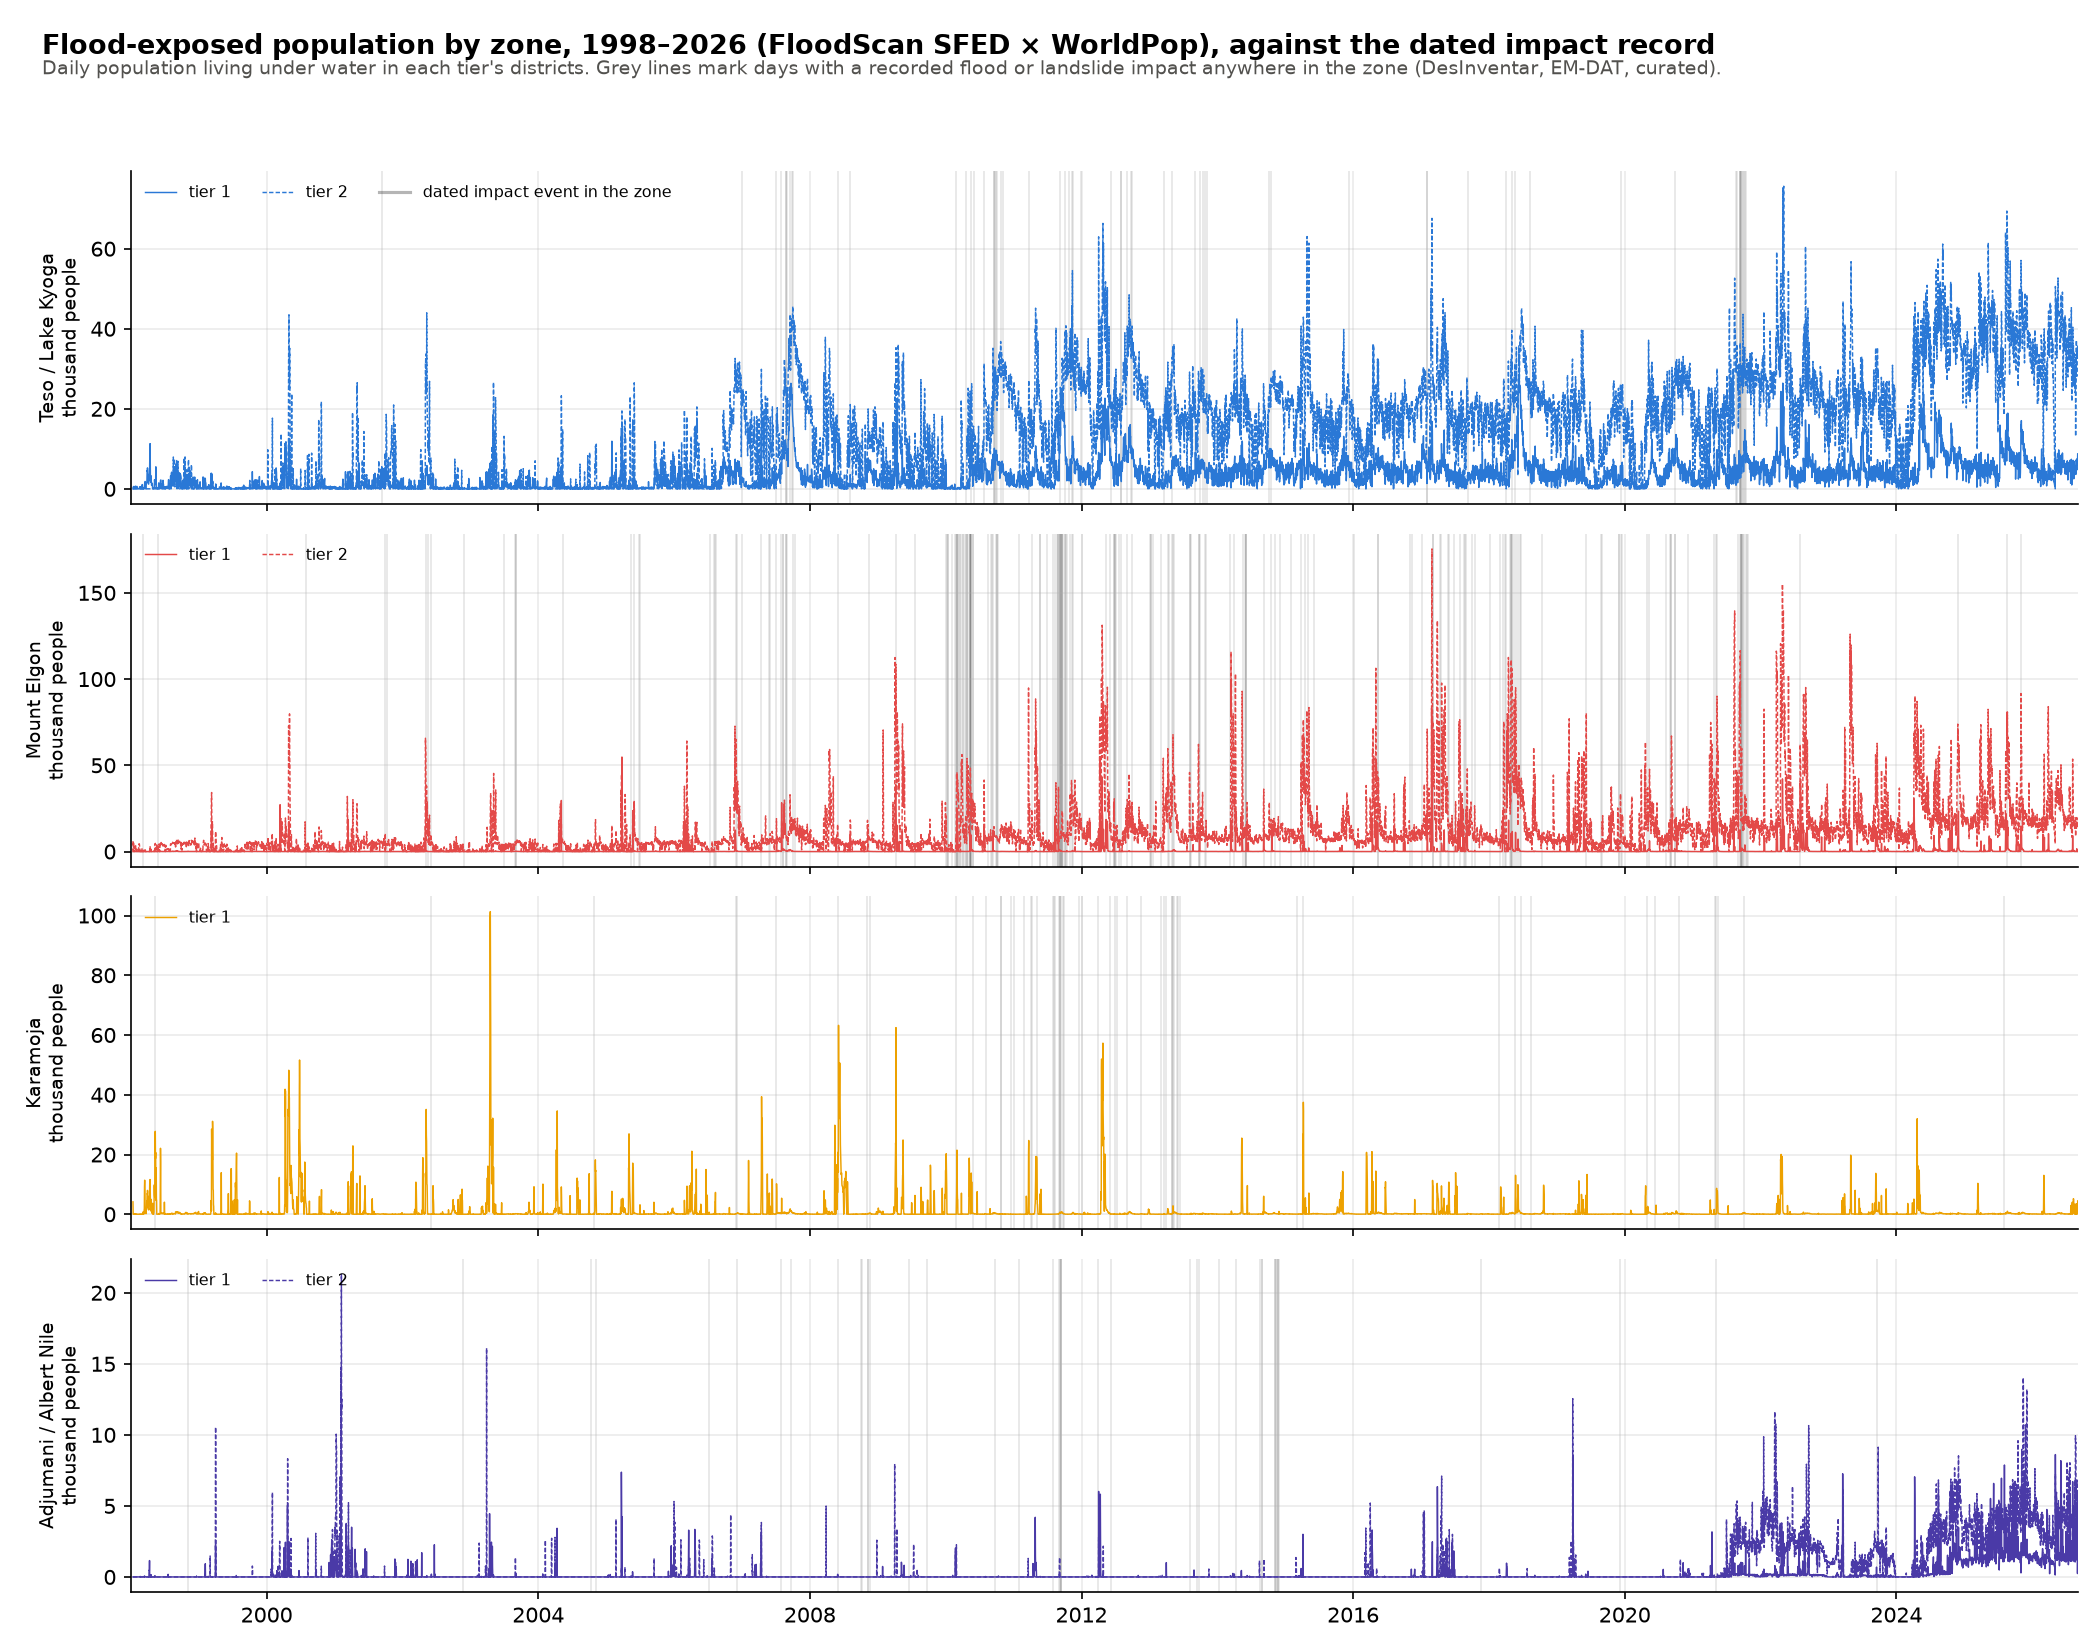
Extent answers “is there water”; exposure answers “is there water where people are”, which is what an observational trigger should key on. Uganda is not one of the countries in the team’s flood-exposure pipeline, so exposure was computed here on the same inputs it uses — WorldPop 2020 1 km UN-adjusted times daily FloodScan SFED — through a population weight matrix, giving daily flood-exposed population per district back to 1998.
| area | dated events | peak people exposed | AUC extent | AUC exposure | event percentile, extent | event percentile, exposure |
|---|---|---|---|---|---|---|
| Teso / Lake Kyoga - tier 1 | 57 | 27,798 | 0.68 | 0.73 | 93 | 93 |
| Teso / Lake Kyoga - tier 2 | 19 | 75,615 | 0.71 | 0.68 | 83 | 80 |
| Mount Elgon - tier 1 | 178 | 83,153 | 0.59 | 0.81 | 89 | 89 |
| Mount Elgon - tier 2 | 65 | 175,481 | 0.93 | 0.92 | 88 | 90 |
| Karamoja - tier 1 | 61 | 101,302 | 0.39 | 0.45 | 85 | 85 |
| Adjumani / Albert Nile - tier 1 | 23 | 8,613 | 0.37 | 0.41 | 36 | 36 |
| Adjumani / Albert Nile - tier 2 | 24 | 21,299 | 0.30 | 0.32 | 37 | 37 |
Reading: exposure is the better witness in five of the seven tiers, and on the Mount Elgon slopes it lifts the year-level AUC from 0.59 to 0.81. The slopes are densely populated, so a flooded patch far too small to move a district-mean extent still puts thousands of people in water. Karamoja improves and stays weak at year level, and both Adjumani tiers sit around the 36th percentile at their events — below chance — so exposure confirms the Albert Nile is invisible rather than rescuing it.
Backstop options: satellite, observed rainfall, or either#
The backstop exists so a forecast miss still activates, and FloodScan alone cannot serve three of the four zones. This tests an observed-rainfall leg alongside it — rain that has already fallen (IMERG), not forecast, so no forecast skill is involved — and the OR of the two. Both legs at a 3-year return period, scored against major events (5 or more deaths, or 5,000 or more affected) within three days.
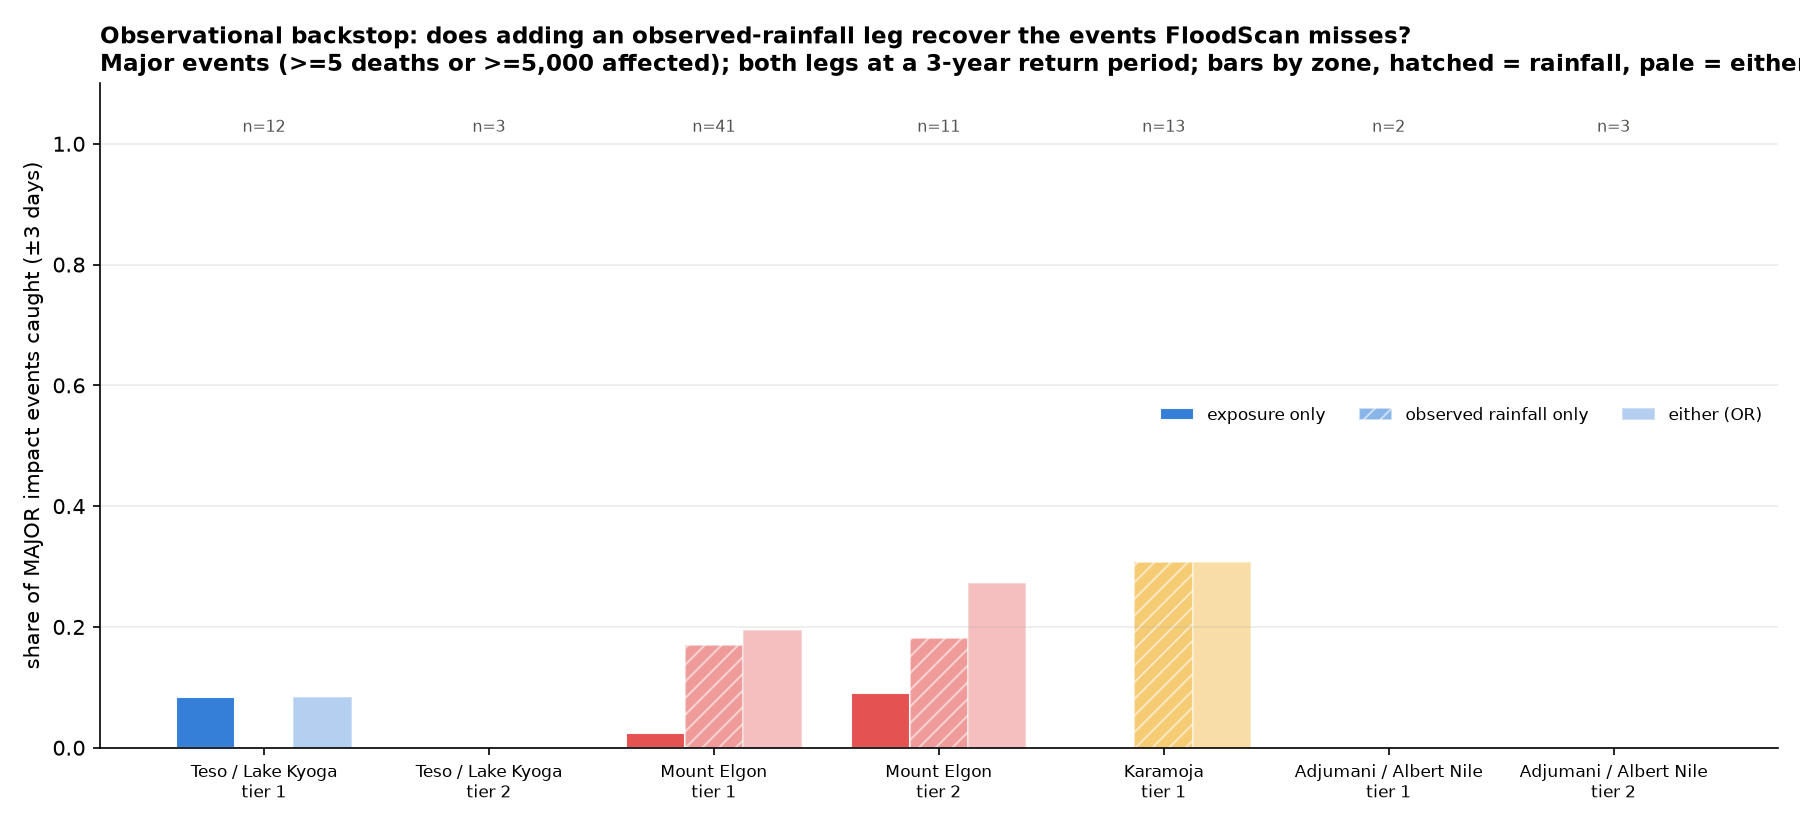
| area | major events | exposure only | observed rainfall only | either (OR) | activations/year (OR) |
|---|---|---|---|---|---|
| Adjumani / Albert Nile - tier 1 | 2 | 0% | 0% | 0% | 1.7 |
| Adjumani / Albert Nile - tier 2 | 3 | 0% | 0% | 0% | 1.7 |
| Mount Elgon - tier 1 | 41 | 2% | 17% | 20% | 1.7 |
| Mount Elgon - tier 2 | 11 | 9% | 18% | 27% | 2.2 |
| Karamoja - tier 1 | 13 | 0% | 31% | 31% | 2.2 |
| Teso / Lake Kyoga - tier 1 | 12 | 8% | 0% | 8% | 2.2 |
| Teso / Lake Kyoga - tier 2 | 3 | 0% | 0% | 0% | 1.6 |
Reading: the rainfall leg is what makes an observational backstop work outside Teso. In Karamoja it is the only leg that works at all — exposure catches none of the 13 major events, rainfall catches 31 %. On the Elgon slopes it takes the catch from 2 % to 20 %, and in the Elgon lowlands from 9 % to 27 %. In Teso it adds nothing, which is the right answer: those floods are slow and riverine rather than rain-day events, and the satellite already sees them. In Adjumani neither leg catches anything at any rarity, the clearest statement yet that the zone needs a river gauge or the lake level rather than an event trigger.
The uncomfortable number: even with both legs, a backstop at 3-year rarity catches only a fifth to a third of major events. Loosening to a 2-year level buys little (Elgon slopes 20 % to 22 %, Karamoja unchanged at 31 %) while raising activations from about 1.7 to 2.6 a year. An observational backstop is a safety net against the worst misses, not a second trigger, and it should be described that way to the fund.
A partner’s draft Elgon triggers#
A partner has circulated a draft anticipatory-action plan for the Mount Elgon sub-region whose design overlaps this zone closely, including a rainfall-plus-soil-moisture trigger of the same shape as the one tested above. We have backtested its triggers against the same record used throughout this page. The plan is not published, so its scope, thresholds and budget are not reproduced here; the plan and our backtest of it are on the restricted partner page (password shared internally).
The one finding that is ours to state, because it comes from our own analysis rather than their document: a rainfall threshold on these slopes has a low ceiling whatever level it is set at. At about four activations a year the best any threshold we tested manages is roughly a fifth of major events, and precision stays under 15 %. A threshold set high enough to be rare enough for an action trigger stops catching events altogether. That is the same limit our own rainfall work ran into, and it argues for a rainfall leg carrying readiness while a gauge or a discharge signal carries the action decision. It also matters which spatial scale and which rainfall product a threshold is calibrated on — the same number means very different things as an areal average and as a point reading, and satellite rainfall underestimates extremes in mountains, so a gauge-calibrated threshold does not transfer to satellite monitoring unchanged.
A second witness: Copernicus EMS rapid mapping#
The team's CEMS flood archive holds every Copernicus EMS rapid-mapping flood activation since 2012 as harmonised polygons with acquisition dates. Uganda has three: EMSR438 (May 2020, the East Africa rains; three areas of interest with observed flooding, six acquisition dates), EMSR446 (June to September 2020, the Ministry of Water's request on rising lake levels; eleven dates) and EMSR662 (May 2023, the Katonga river at Nkozi). Each district-day of CEMS flooding is compared with the FloodScan district-mean extent on the same day.
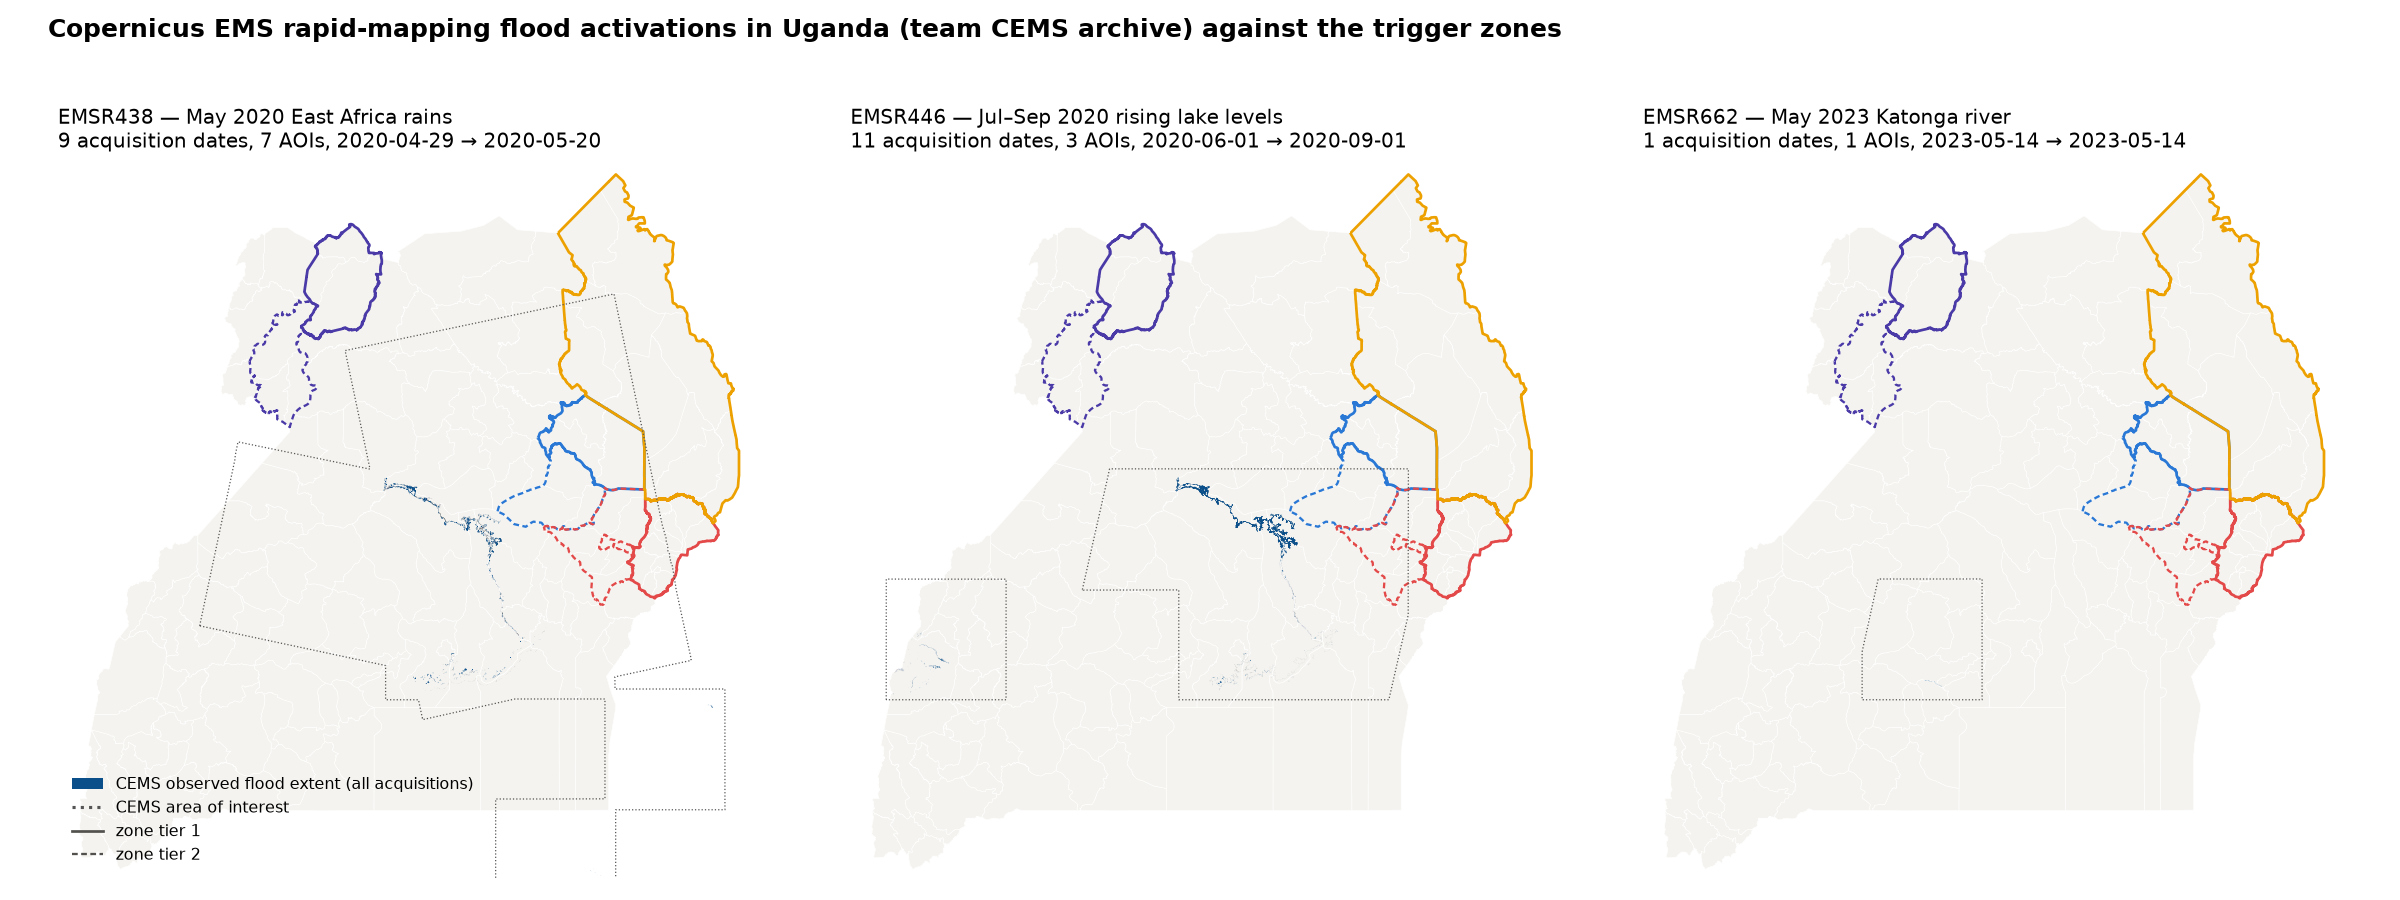
Reading: all three activations mapped ground outside the zones — the Lake Kyoga south shore (Nakasongola, Buyende, Kayunga), Kampala and the Katonga — so they cannot validate the zones directly. What they do test is FloodScan on lake-driven flooding, and the answer is blunt: across 75 district-days with at least 5 km² of CEMS-mapped water, FloodScan showed essentially nothing on 93 percent of them and was above its 90th percentile on 11 percent; the rank correlation between the two is zero. The 2020 lake-rise flooding of Kyoga's shore, the same mechanism as the Albert Nile and Lake Albert shore floods in the Adjumani zone, is invisible to the 9-km product. That is consistent with the Adjumani result above and settles that the observational leg for lake-driven floods has to be lake level or gauges, not satellite extent. Global Flood Monitoring (Sentinel-1) has no Uganda coverage in the team's store and was not pulled for this pass.
How much of the recorded impact do the zones cover?#
Every district classified as zone core, zone tier 2, partner-only (in a standing flood AA of IFRC, WFP, CRS/Caritas or DRC but not in our zones) or uncovered, with the 1998–2025 record summed per class.
| class | districts | people affected | % affected | deaths | % deaths | district-years with a record | % district-years |
|---|---|---|---|---|---|---|---|
| zone core | 24 | 1,410,237 | 39 | 1,065 | 56 | 212 | 28 |
| zone tier 2 | 12 | 516,093 | 14 | 132 | 7 | 81 | 11 |
| partner only | 5 | 640,921 | 18 | 276 | 14 | 85 | 11 |
| uncovered | 94 | 1,056,547 | 29 | 439 | 23 | 381 | 50 |
Reading: the four zones with their second tiers hold just over half of all recorded people affected and about two thirds of recorded deaths; the partner-only districts (Kasese, Kisoro, Ntoroko, Bundibugyo under WFP; Kampala under the IFRC EAP) add another sixth of affected. The uncovered remainder is spread thinly over about ninety districts with no single large gap: the biggest are Masaka, Amuru, Kabale, Otuke and Zombo, each under 100,000 cumulative affected and mostly single-source DesInventar records.
Impact record assembled#
- EM-DAT — 47 flood and wet mass-movement events 2001–2024, exploded to districts.
- DesInventar Uganda — about 1,500 flood, 370 landslide and 130 rainstorm datacards, day-dated and district-matched, 1933–2021 (no 2019 records; ends 2021).
- IOM DTM — affected people by district and reporting round, Oct 2023 – Oct 2025 (country-team compilation).
- Curated events — dated Elgon and Karamoja flash floods / landslides and West Nile floods 2007–2025, each with a source.
Data built for the analysis#
- FloodScan SFED and IMERG rainfall, daily per district (mean and max), 1998–present.
- CHIRPS-GEFS 5-day rainfall forecast per district, daily issues 2000 – Jul 2026 (the forecast leg of the flash-flood skill chain).
- GloFAS v4 reanalysis 1999–2024 (Uganda box) and G5196 reforecast 2003–2023 (leads 1–15 days).
- Lake Victoria, Kyoga and Albert altimetry levels.
Uganda is capped at admin 1 in the team rasterstats database, so the district series are computed from the processed rasters directly.
Next#
- Flash-flood skill chain for Elgon and Karamoja: CHIRPS-GEFS 5-day forecast vs IMERG, then observed rain vs the DesInventar / DTM / curated events.
- G5196: model-space return-period thresholds from the reforecast climatology; backtest of readiness (10–14 d) and action (3–7 d) windows against the 2007, 2011–2013, 2018 and 2025 Teso floods.
- Adjumani: lake-level leg (Kyoga/Albert percentile) plus rainfall leg; extend the Albert record back to 2002 via DAHITI/Hydroweb.
Generated 2026-09-30 by pipeline/build_pages.py in
OCHA-DAP/ds-aa-uga-flooding. Work in progress — not a trigger.