
When the watch page shows REACHED
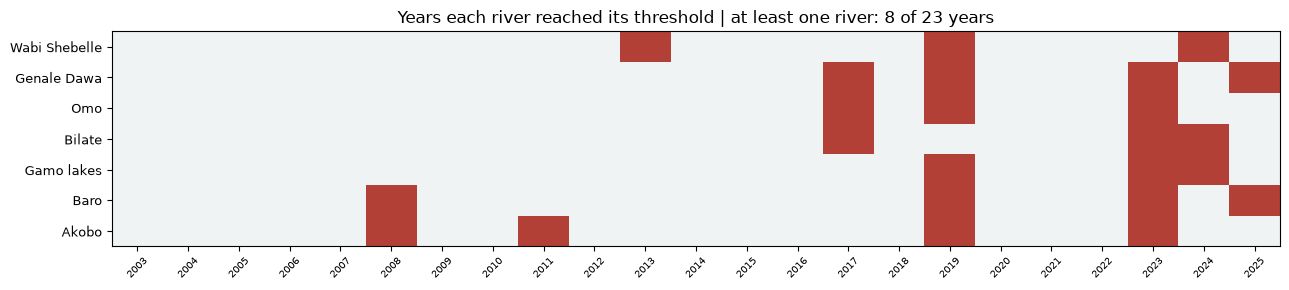
The watch page shows REACHED when any of the seven river systems (Wabi Shebelle | Genale Dawa | lower Omo | Bilate | Abaya-Chamo lakes | Baro | Akobo) is at or over its OND threshold on a forecast day between 1 October and 31 December. Each river's threshold starts at the peak of its 3rd-largest OND season on the 2003 to 2025 GloFAS record and is lowered where that catches further seasons in years when a threshold was already reached, without letting any new year in: a 1-in-8 to 1-in-6 event depending on the river. On the record, at least one river is at or over its threshold in 8 years in 23 = 1-in-3.0 (2008, 2011, 2013, 2017, 2019, 2023, 2024, 2025). This is monitoring only: there is no official trigger behind this page and nothing is released when a threshold is reached.
Rivers and zones monitored
The watch covers the river basin and zone pairs the EDRMC Bega flood alert lists as at risk of riverine flooding: the middle and lower Wabi Shebelle (Shebelle zone) | the lower Genale Dawa (Afder, Liben, Dawa) | the lower Omo (South Omo) | the Bilate (Sidama, West Guji) | the Kulfo, Slena and Sego at Arba Minch (Gamo) | the Akobo (Agnewak) | the Baro (Itang, Nuwer, Agnewak). Fourteen GloFAS points monitor these reaches; each sits on a channel cell verified against the model's own discharge field and named river geometry.
River thresholds, station by station
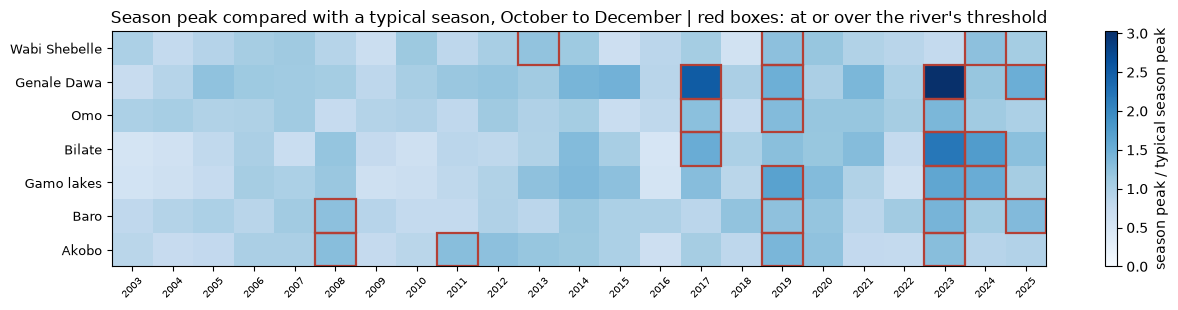
Each station's typical season peak is the median of its 23 October to December peaks (the highest daily flow of each season, 2003 to 2025). Each season, every station's peak is compared with its typical peak, and the river takes its highest station. The river's factor starts at its 3rd-biggest season and is lowered to also catch lower-ranked seasons in years when a threshold was already reached, stopping at the first season outside them so no new year can enter (Genale Dawa and Baro gain 2019, Akobo gains 2008). Each station's threshold is its typical season peak times the river's factor. Record: GloFAS version 4 reanalysis, October to December, 2003 to 2025; version 4 is used because the live forecast runs on it.
| River system | Station | Zone | Typical season peak (m³/s) | Threshold (m³/s) | Threshold vs typical peak |
|---|---|---|---|---|---|
| Wabi Shebelle | Shabelle at Gode (G1904) | Shebelle | 989 | 1,213 | 1.23 |
| Shabelle upstream (43.03E 6.08N) | Shebelle | 987 | 1,210 | 1.23 | |
| Shabelle mid (44.13E 5.63N) | Shebelle | 989 | 1,213 | 1.23 | |
| Shabelle lower (44.53E 5.43N) | Shebelle | 989 | 1,213 | 1.23 | |
| Shabelle at border (44.83E 5.13N) | Shebelle | 989 | 1,213 | 1.23 | |
| Genale Dawa | Genale upper (40.45E 5.35N) | Liban | 527 | 790 | 1.50 |
| Genale/Juba at Dolow | Liban | 1,559 | 2,337 | 1.50 | |
| Dawa (40.73E 4.43N) | Daawa | 280 | 419 | 1.50 | |
| Webe Gestro (42.08E 4.73N) | Afder | 193 | 290 | 1.50 | |
| Omo | Omo lower (South Omo) | South Omo | 3,806 | 4,830 | 1.27 |
| Bilate | Bilate (Loka Abaya) | Sidama | 142 | 217 | 1.53 |
| Gamo lakes | Abaya-Chamo lakes (Kulfo area) | Gamo | 462 | 707 | 1.53 |
| Baro | Baro at Itang | Itang Special woreda | 1,601 | 1,989 | 1.24 |
| Akobo | Akobo (Agnewak) | Agnewak | 285 | 368 | 1.29 |
Threshold vs typical peak: the river's factor. 1.23 means the threshold is 23% above a typical season's peak. Every station on a river shares its river's factor.
October to December seasons, 2003 to 2025
| River system | OND seasons at or over its threshold | Frequency |
|---|---|---|
| Wabi Shebelle | 2013 2019 2024 | 1-in-8 |
| Genale Dawa | 2017 2019 2023 2025 | 1-in-6 |
| Omo | 2017 2019 2023 | 1-in-8 |
| Bilate | 2017 2023 2024 | 1-in-8 |
| Gamo lakes | 2019 2023 2024 | 1-in-8 |
| Baro | 2008 2019 2023 2025 | 1-in-6 |
| Akobo | 2008 2011 2019 2023 | 1-in-6 |
| Any river (overall) | 2008 2011 2013 2017 2019 2023 2024 2025 | 1-in-3.0 |
Years reached and recorded floods
Three records beside the years when a threshold was reached: FloodScan flood events in the Somali-region riverine zones (satellite; the extract for the other zones is not built and is a named gap), EM-DAT flood events whose locations name the riverine areas and whose dates touch OND (manually refreshed snapshot), and CERF allocations to Ethiopia with emergency type flood (national record).
| Year | Threshold reached | FloodScan RP5 | EM-DAT riverine floods | CERF flood allocations |
|---|---|---|---|---|
| 2003 | ||||
| 2004 | ||||
| 2005 | ||||
| 2006 | 1 event : 361,600 affected | USD 5.0M (2) | ||
| 2007 | 1 event : 239,586 affected | |||
| 2008 | reached | 1 event : 23,831 affected | ||
| 2009 | ||||
| 2010 | ||||
| 2011 | reached | 1 event : 40,200 affected | ||
| 2012 | ||||
| 2013 | reached | |||
| 2014 | ||||
| 2015 | 1 event : 210,600 affected | |||
| 2016 | ||||
| 2017 | reached | |||
| 2018 | USD 5.3M (1) | |||
| 2019 | reached | 1 event : 200,000 affected | ||
| 2020 | USD 8.0M (1) | |||
| 2021 | ||||
| 2022 | 1 event : 264,831 affected | |||
| 2023 | reached | 1 event : 1,500,000 affected | USD 8.0M (1) | |
| 2024 | reached | |||
| 2025 | reached |
Shaded rows: years when a threshold was reached. The FloodScan column covers the Somali-region zones only; a dot marks a season with a flood event at that severity.
Comparison with GloFAS version 5
The watch uses GloFAS version 4 thresholds, the version the live forecast runs. For reference, the same method on version 5 reanalysis (notebook 05) reaches a threshold in 9 years instead of 8: six years are shared, version 5 adds 2014, 2020 and 2021, and drops 2011 and 2013.
| Record | Years reached | Overall frequency | EM-DAT years caught | CERF years caught | Years |
|---|---|---|---|---|---|
| v4, the watch record live | 8 of 23 | 1-in-3.00 | 4 of 7 | 1 of 4 | 2008, 2011, 2013, 2017, 2019, 2023, 2024, 2025 |
| v5, this test | 9 of 23 | 1-in-2.67 | 3 of 7 | 2 of 4 | 2008, 2014, 2017, 2019, 2020, 2021, 2023, 2024, 2025 |
Version 5 thresholds are not used in monitoring yet: GloFAS version 5 forecasts are coming soon.
Forecast range: 10 days
Monitoring reads the operational GloFAS ensemble median at leads 1 to 10 days. GloFAS publishes to 30 days; 10 days is a monitoring choice. It gives the page sight of the October to December window from about 21 September and roughly a week of forecast inside the season.
Limitations
- The Kulfo, Slena and Sego at Arba Minch are below GloFAS's 0.05 degree grid; the Gamo station is the Abaya-Chamo lake system cell and is labelled as such.
- The Dawa is monitored by a dedicated cell in Daawa zone; the Dolow cell sits below the Genale-Dawa confluence.
- All values are model quantities, not gauge readings.
- Forecast accuracy at each lead time is not shown here.
- FloodScan covers the Somali-region zones only.
Contact
Reach out to OCHA Data Science at ocha-datascience@un.org with any questions.