Main findings
Land, 2001–2020 unless stated, over the 37,500 0.5° cells (76% of non-Antarctic land, 50°S–50°N) that every product covers. "GPCC" = GPCC Full Data v2022. Biases and trends are area-weighted; correlations and triple collocation are medians over cells; tercile scores pool all cells and months.
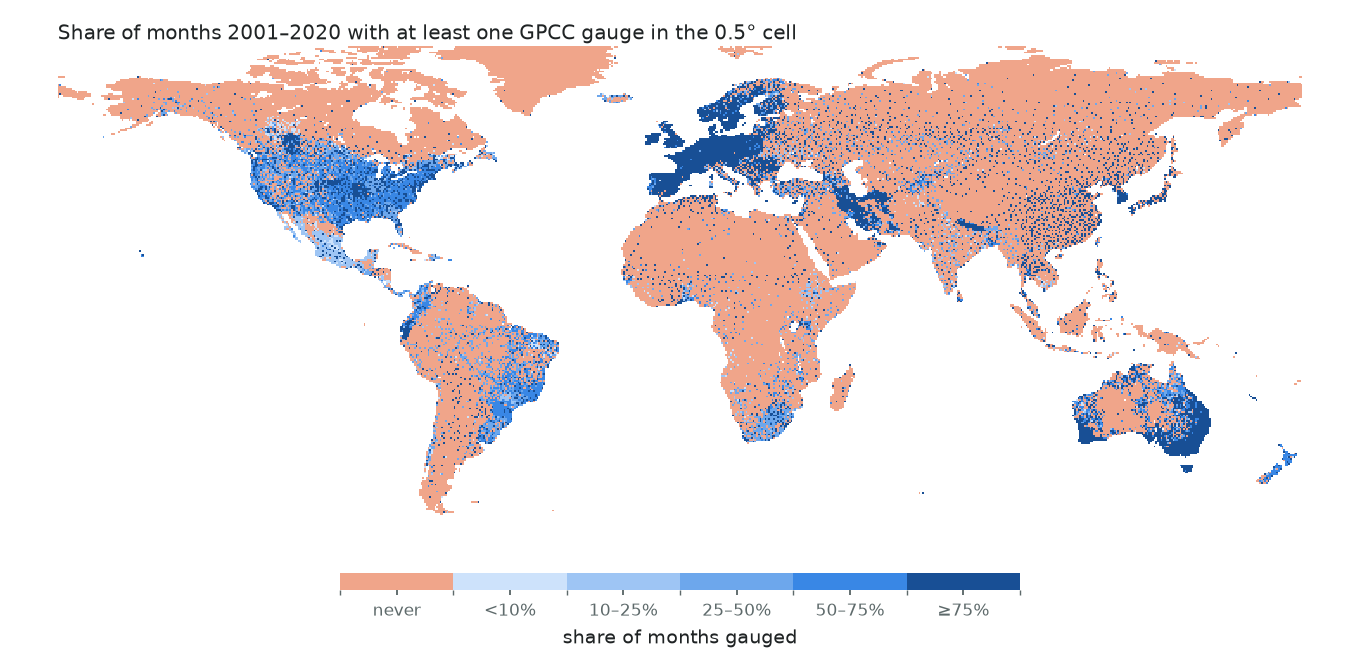
- Most of the land has no rain gauge behind it. Two-thirds of the common domain (24,800 cells) never had a GPCC gauge in 2001–2020; 23% had one in at least half the months. The number of gauges in GPCC Full Data falls from 52,000 a month in 1986 to 12,000 in 2020 — partly a real decline, partly station data that reach GPCC years late and will raise the recent counts in later versions. Every gauge-based number below means less in those cells, including the reference.
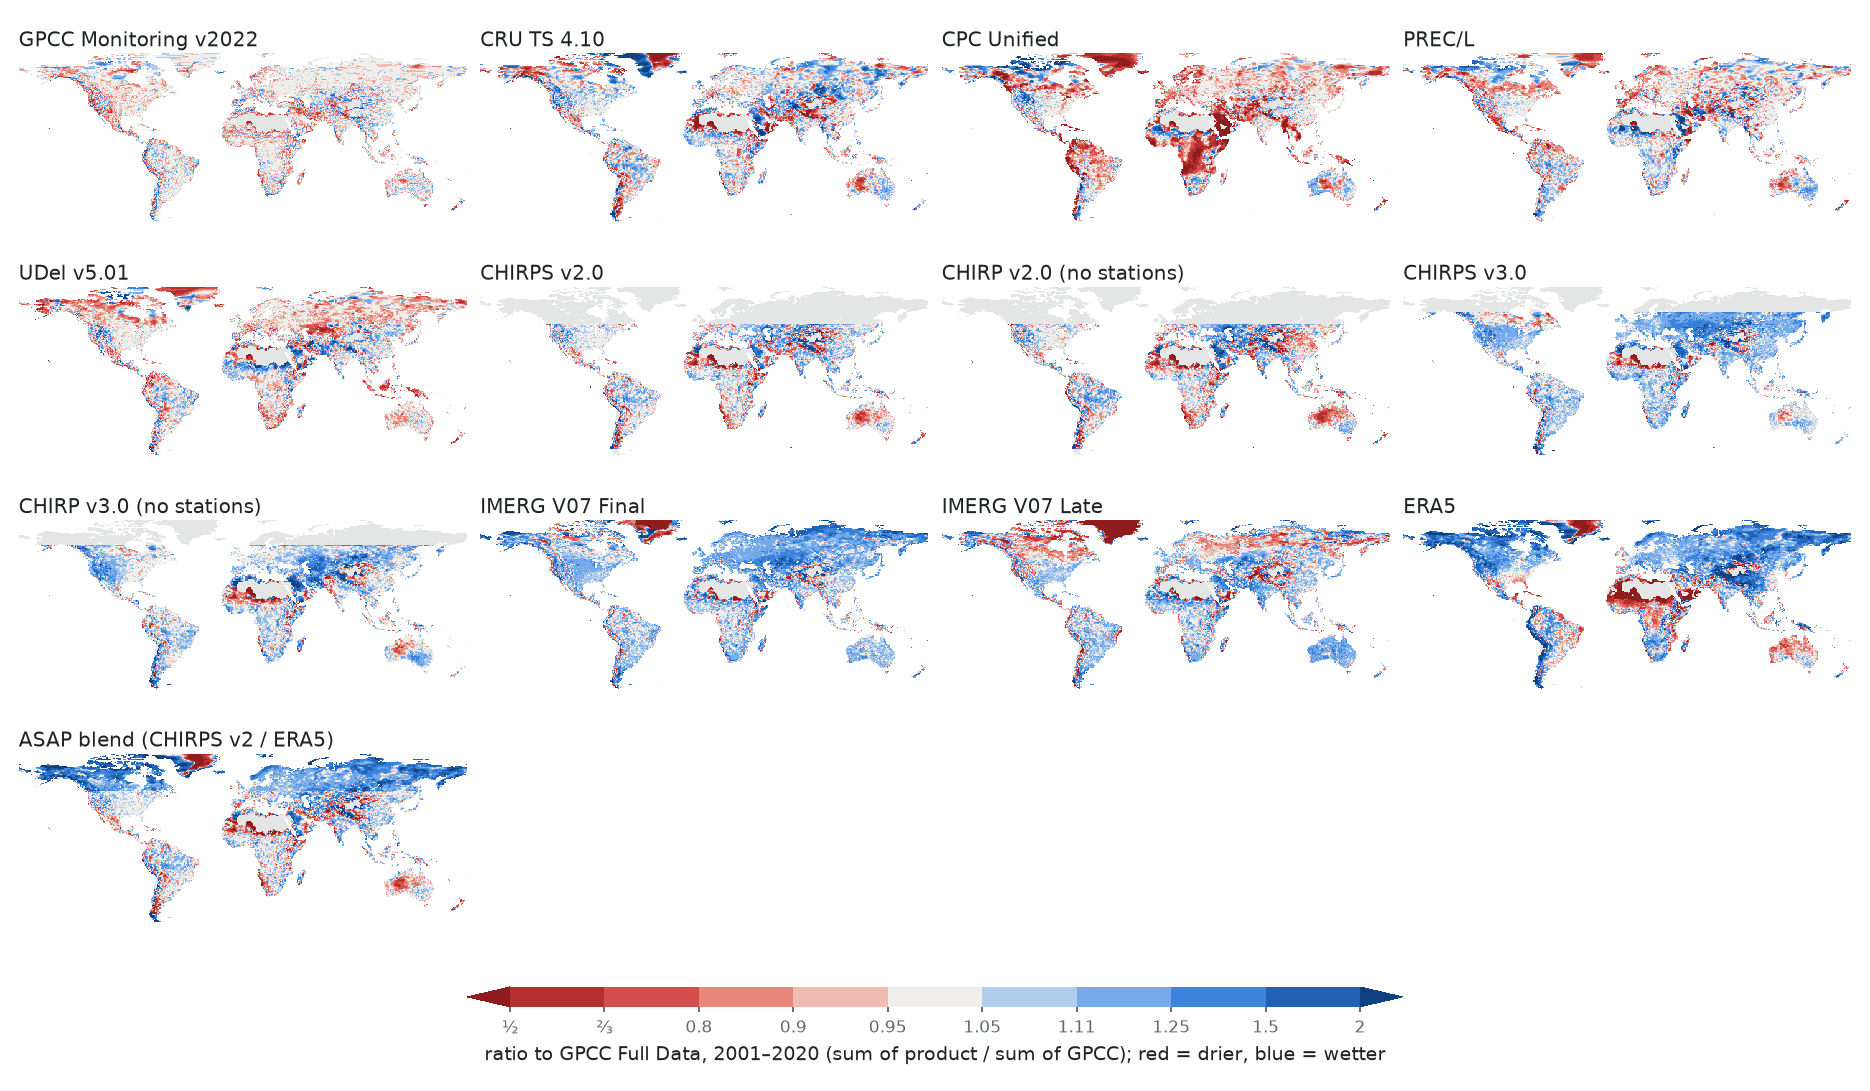
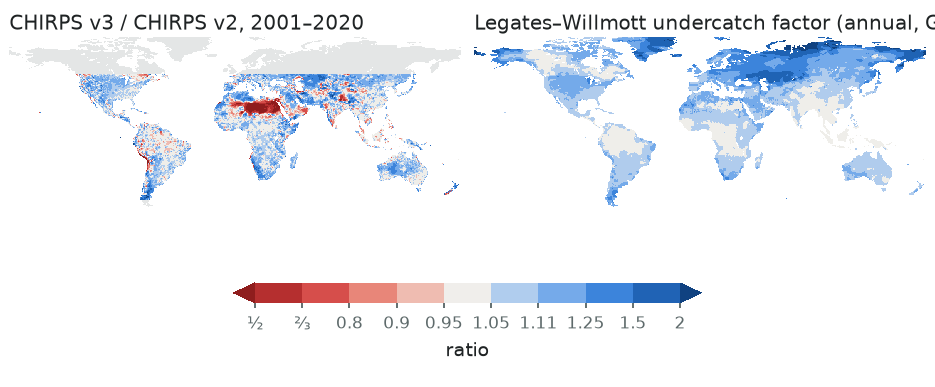
- Average biases are small, and the wet end is consistent with gauge undercatch. Against GPCC: CHIRP v2 +1%, CHIRPS v2 +2%, CHIRP v3 +4%, IMERG Late +4%, IMERG Final +5%, CHIRPS v3 +8%, ERA5 +8%; the gauge analyses within ±2% — except CPC, 14% drier (23% in Africa). With every gauge product lifted by the Legates–Willmott undercatch factors, CHIRPS v3 (1.01), ERA5 (1.02) and IMERG Final (0.99) land on GPCC, while CHIRPS v2 (0.96), CHIRP v2 (0.94) and IMERG Late (0.98) turn slightly dry. CHIRPS v3's extra rain over v2 rises with the undercatch factor (v3/v2 = 1.02 where the factor is below 1.05, 1.28 where it exceeds 1.5) — consistent with v3's station undercatch correction, though the cell-level correlation is only 0.28.
- Regional biases are much larger than the global ones. ERA5 is 15% wetter than GPCC in Asia, 20% wetter in cold climates and 27% wetter poleward of 50°N (where gauges miss snow), near-unbiased over Africa as a whole but 16% too dry in the Sahel (10–18°N) and about a third of GPCC's totals on the Sahara's southern margin (18–22°N). CPC is dry across the tropics.
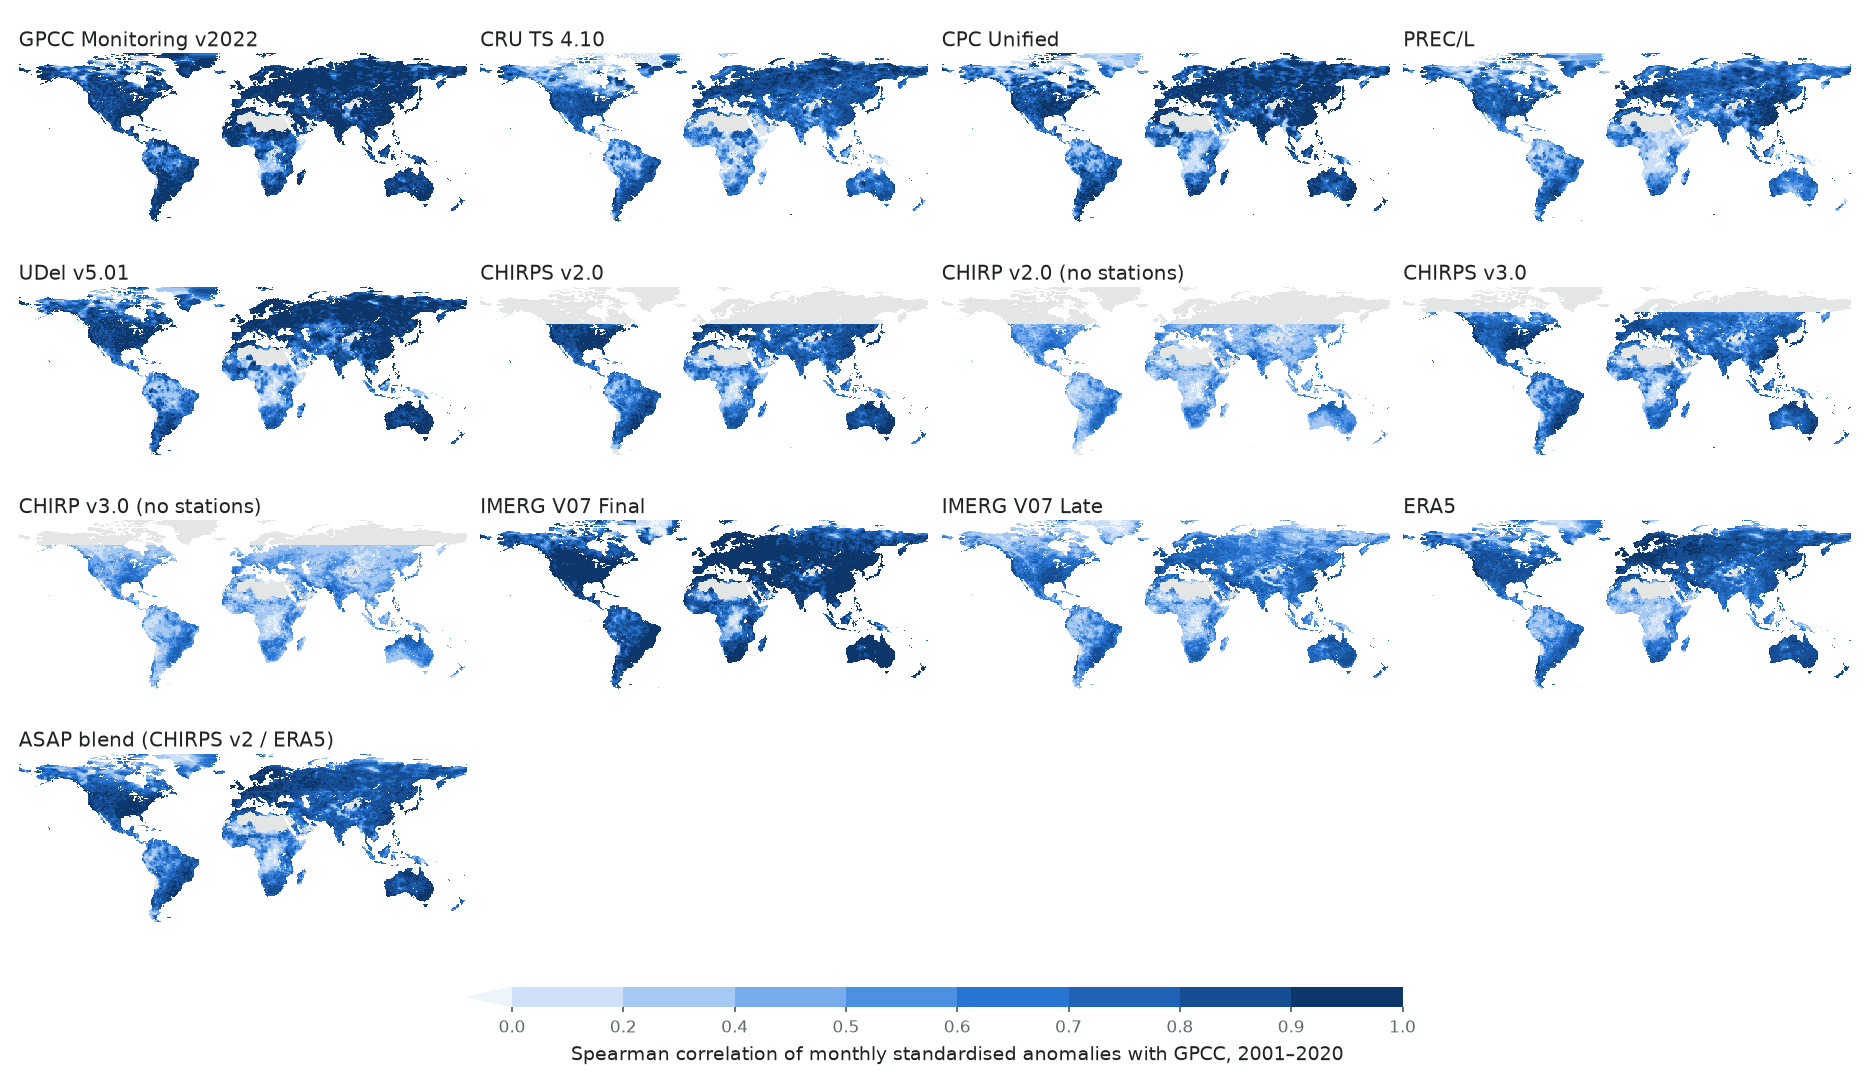
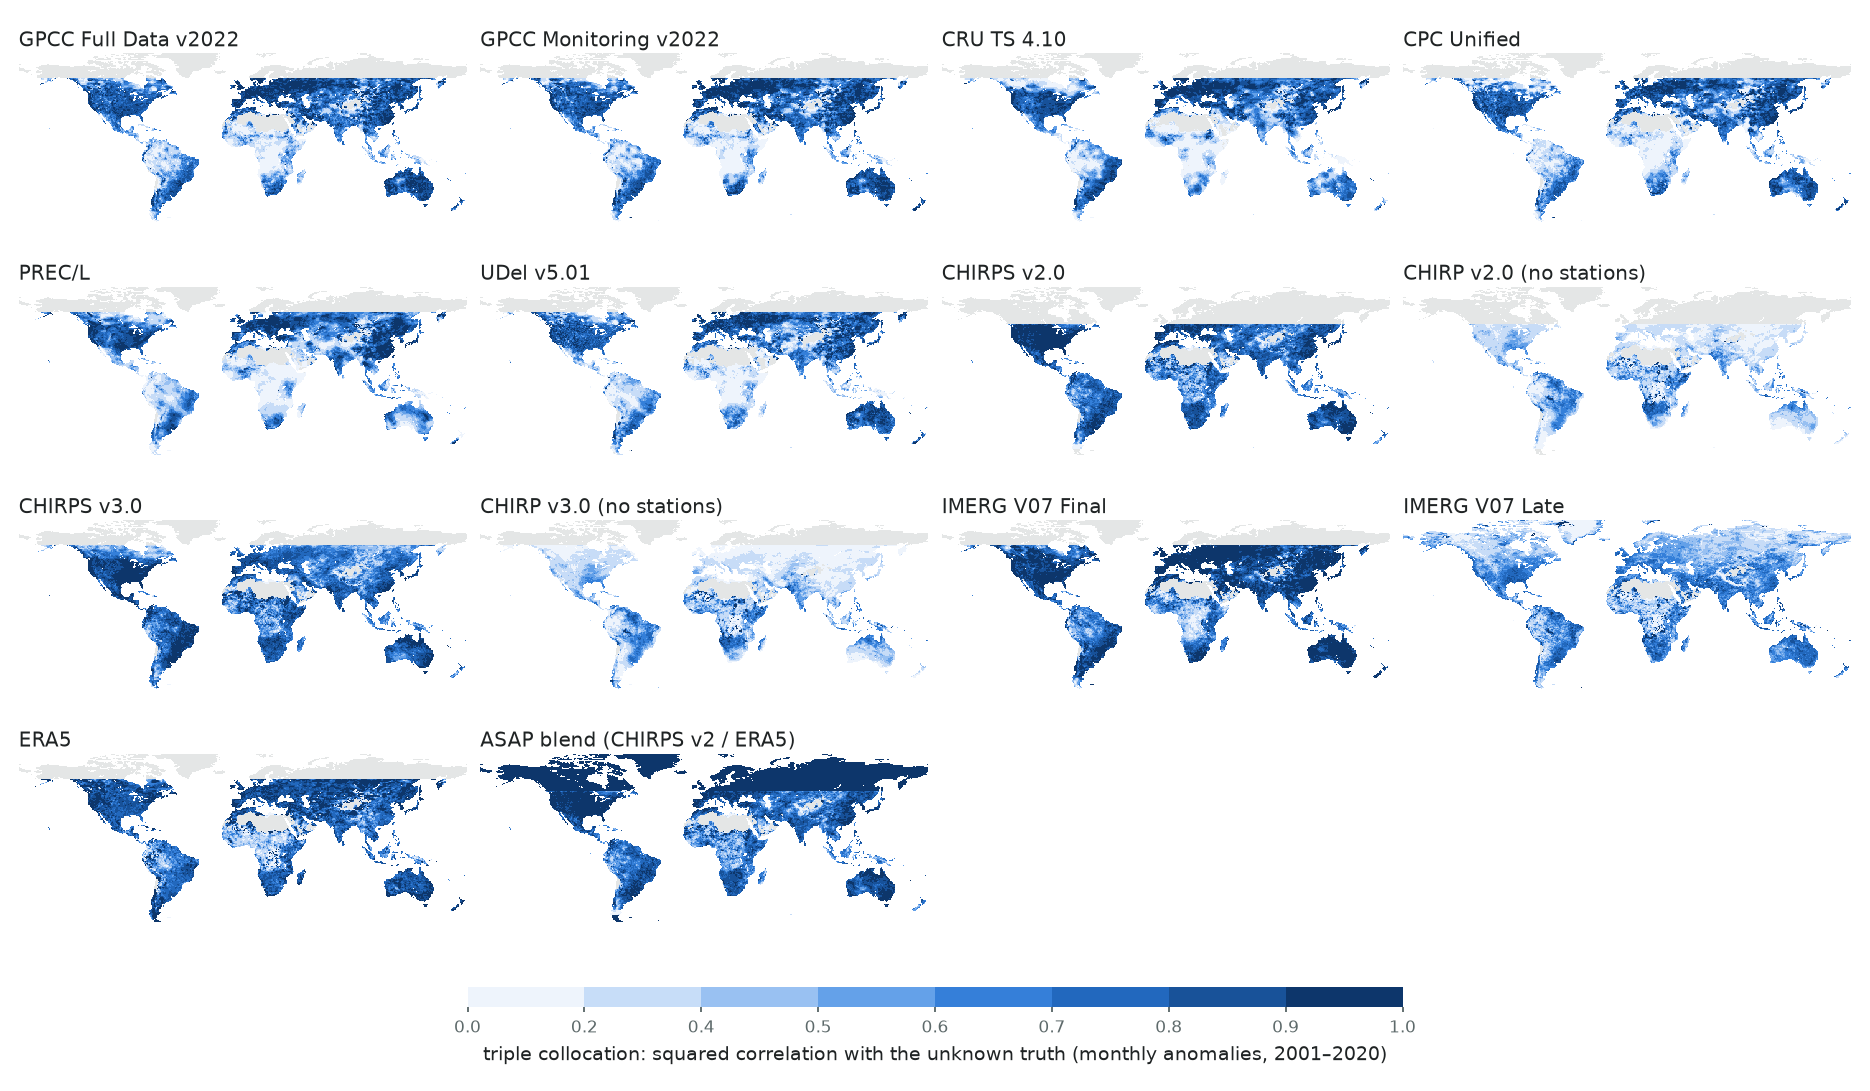
- Where there are no gauges, products stop agreeing on which months are wet or dry — Africa most of all. Median correlation of monthly anomalies with GPCC in Africa: CHIRPS 0.56, CRU 0.49, IMERG Late 0.43, ERA5 0.42, PREC/L 0.42 — the same products reach 0.77–0.89 in Europe. Triple collocation, which needs no reference, reverses the usual ranking there: in Africa CHIRPS v3 (ρ² 0.73), CHIRPS v2 (0.67), IMERG Final (0.60) and ERA5 (0.59) all beat the gauge-only analyses (GPCC 0.34, CRU 0.24), while in Europe GPCC (0.90) is among the best. Without stations CHIRP is weak everywhere (ρ² ≈ 0.35): the stations do most of CHIRPS's work.
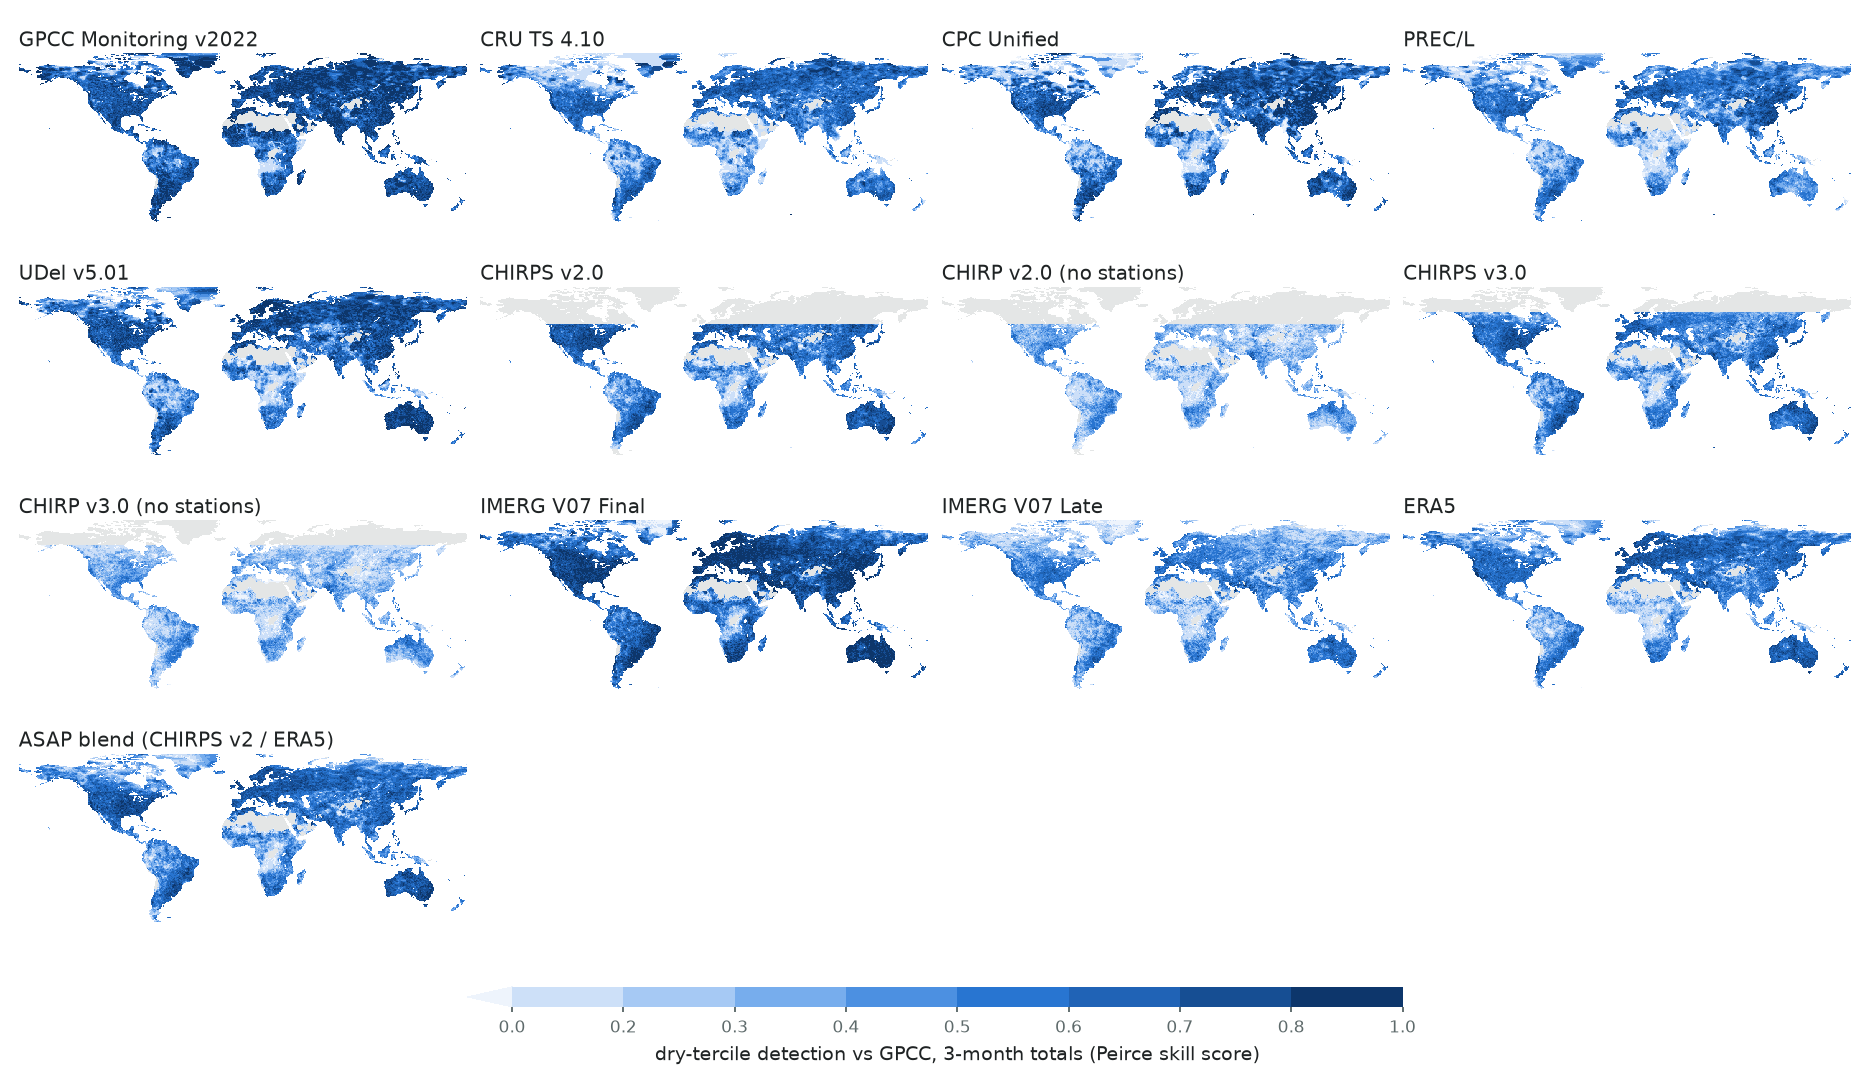
- For drought triggers, the product changes a large share of the calls. For 3-month totals in their own bottom tercile, against GPCC: IMERG Final catches 79% of GPCC's dry seasons and 19% of its dry calls are not dry in GPCC (flattered here — it is calibrated to GPCC — though triple collocation also ranks it first, ρ² 0.85); CHIRPS v2 69% and 29%; ERA5 66% and 32%; IMERG Late 62% and 36%. In Africa the hit rates fall to 51–56% for CHIRPS v2, ERA5 and IMERG Late and the false-alarm ratios rise to 35–41%. Between two gauge-independent products in never-gauged cells (CHIRPS v2 and ERA5, PSS 0.46) agreement is about two dry seasons in three.
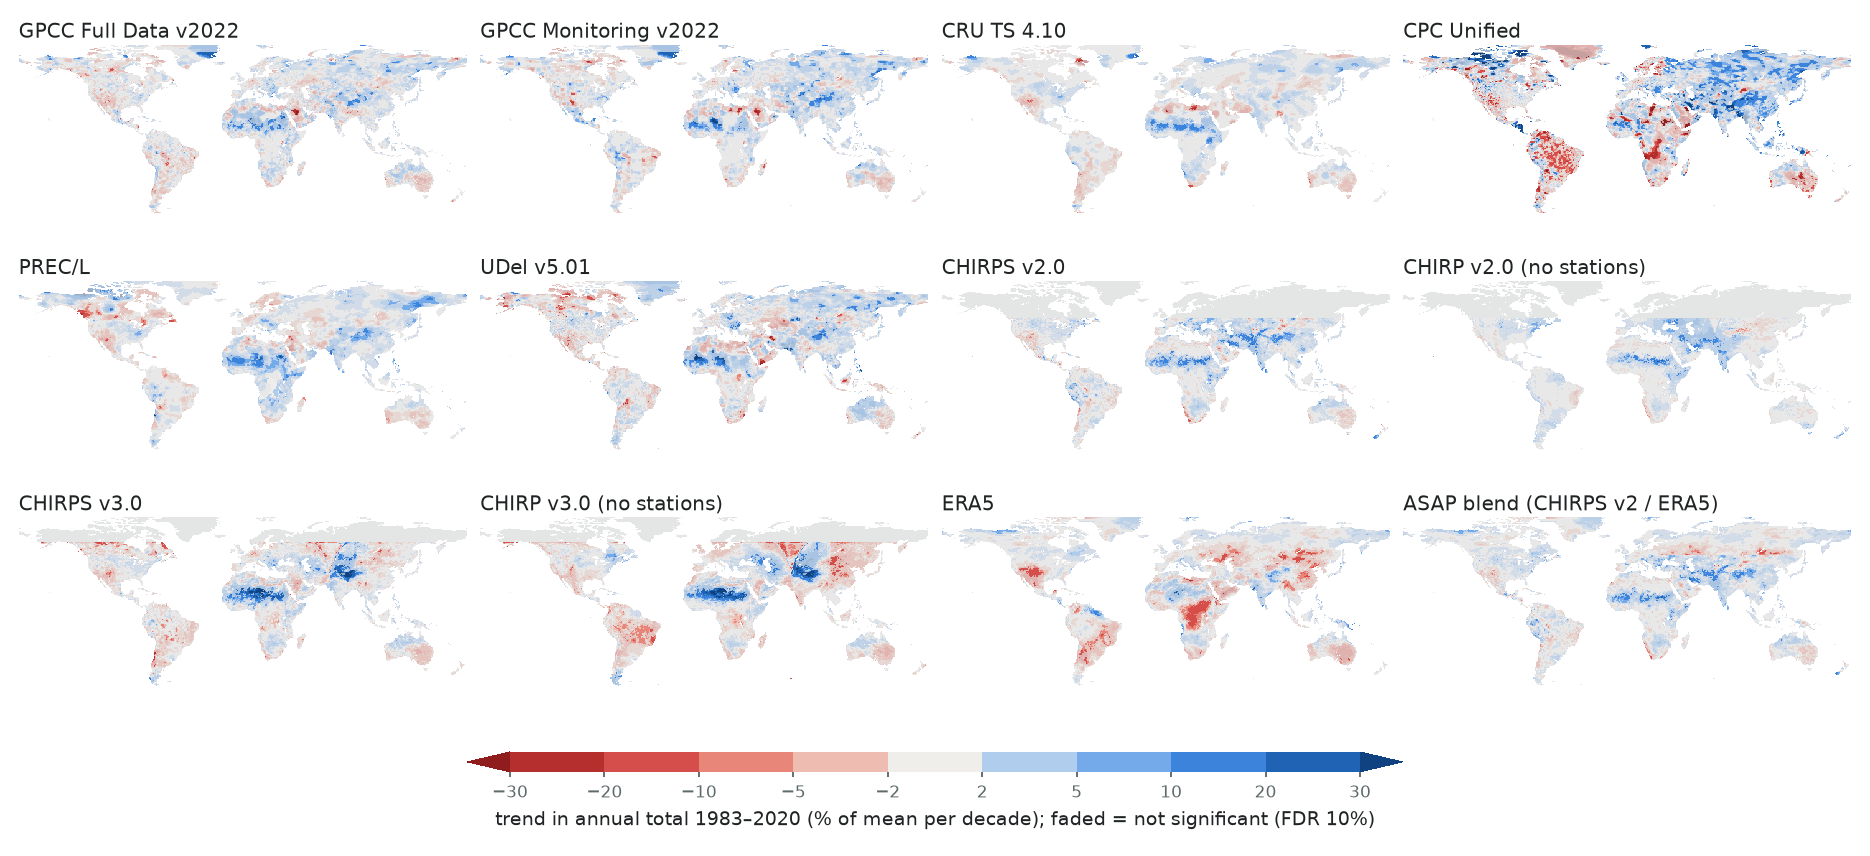
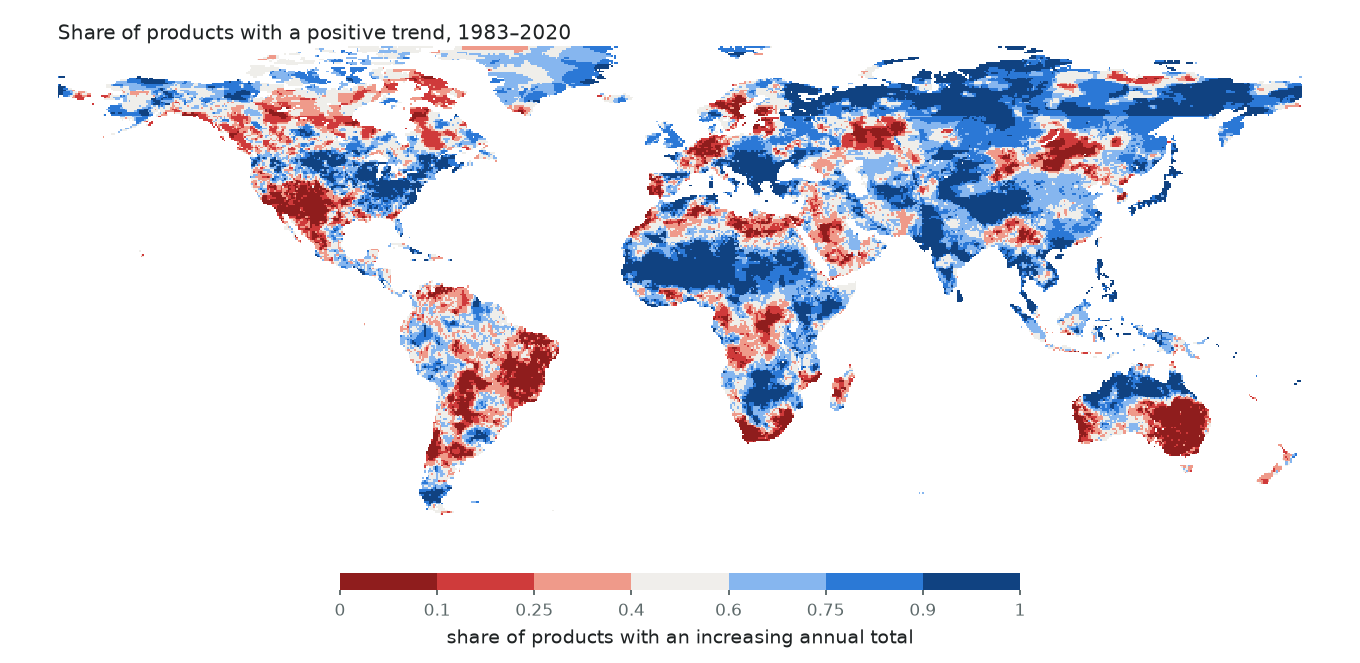
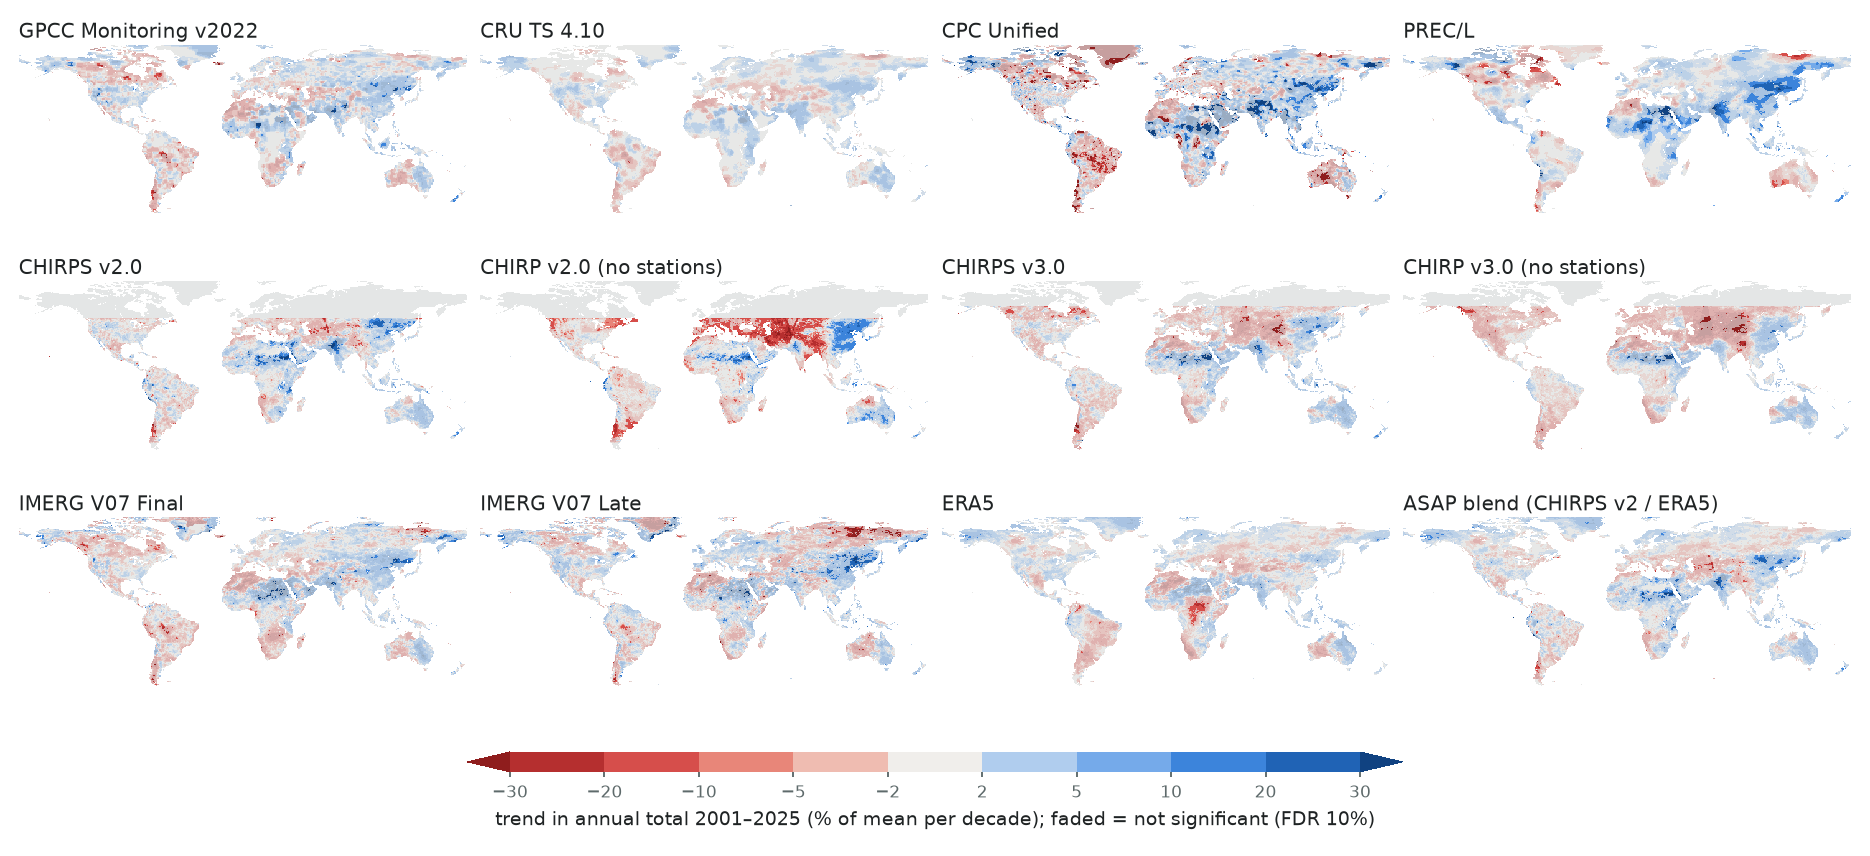
- There is no consensus trend, and several products drift. 1983–2020 trends over the common
domain run from −1.7% per decade (CHIRP v3) to +1.8% (CHIRP v2) — the two station-free satellite
products disagree by 3.5 points — with the gauge analyses at +0.5 to +1.6% (CPC −0.8%). At least 80%
of the 11 independent products agree on the sign over only 46% of the area. Trends of the
difference between two products isolate drifts:
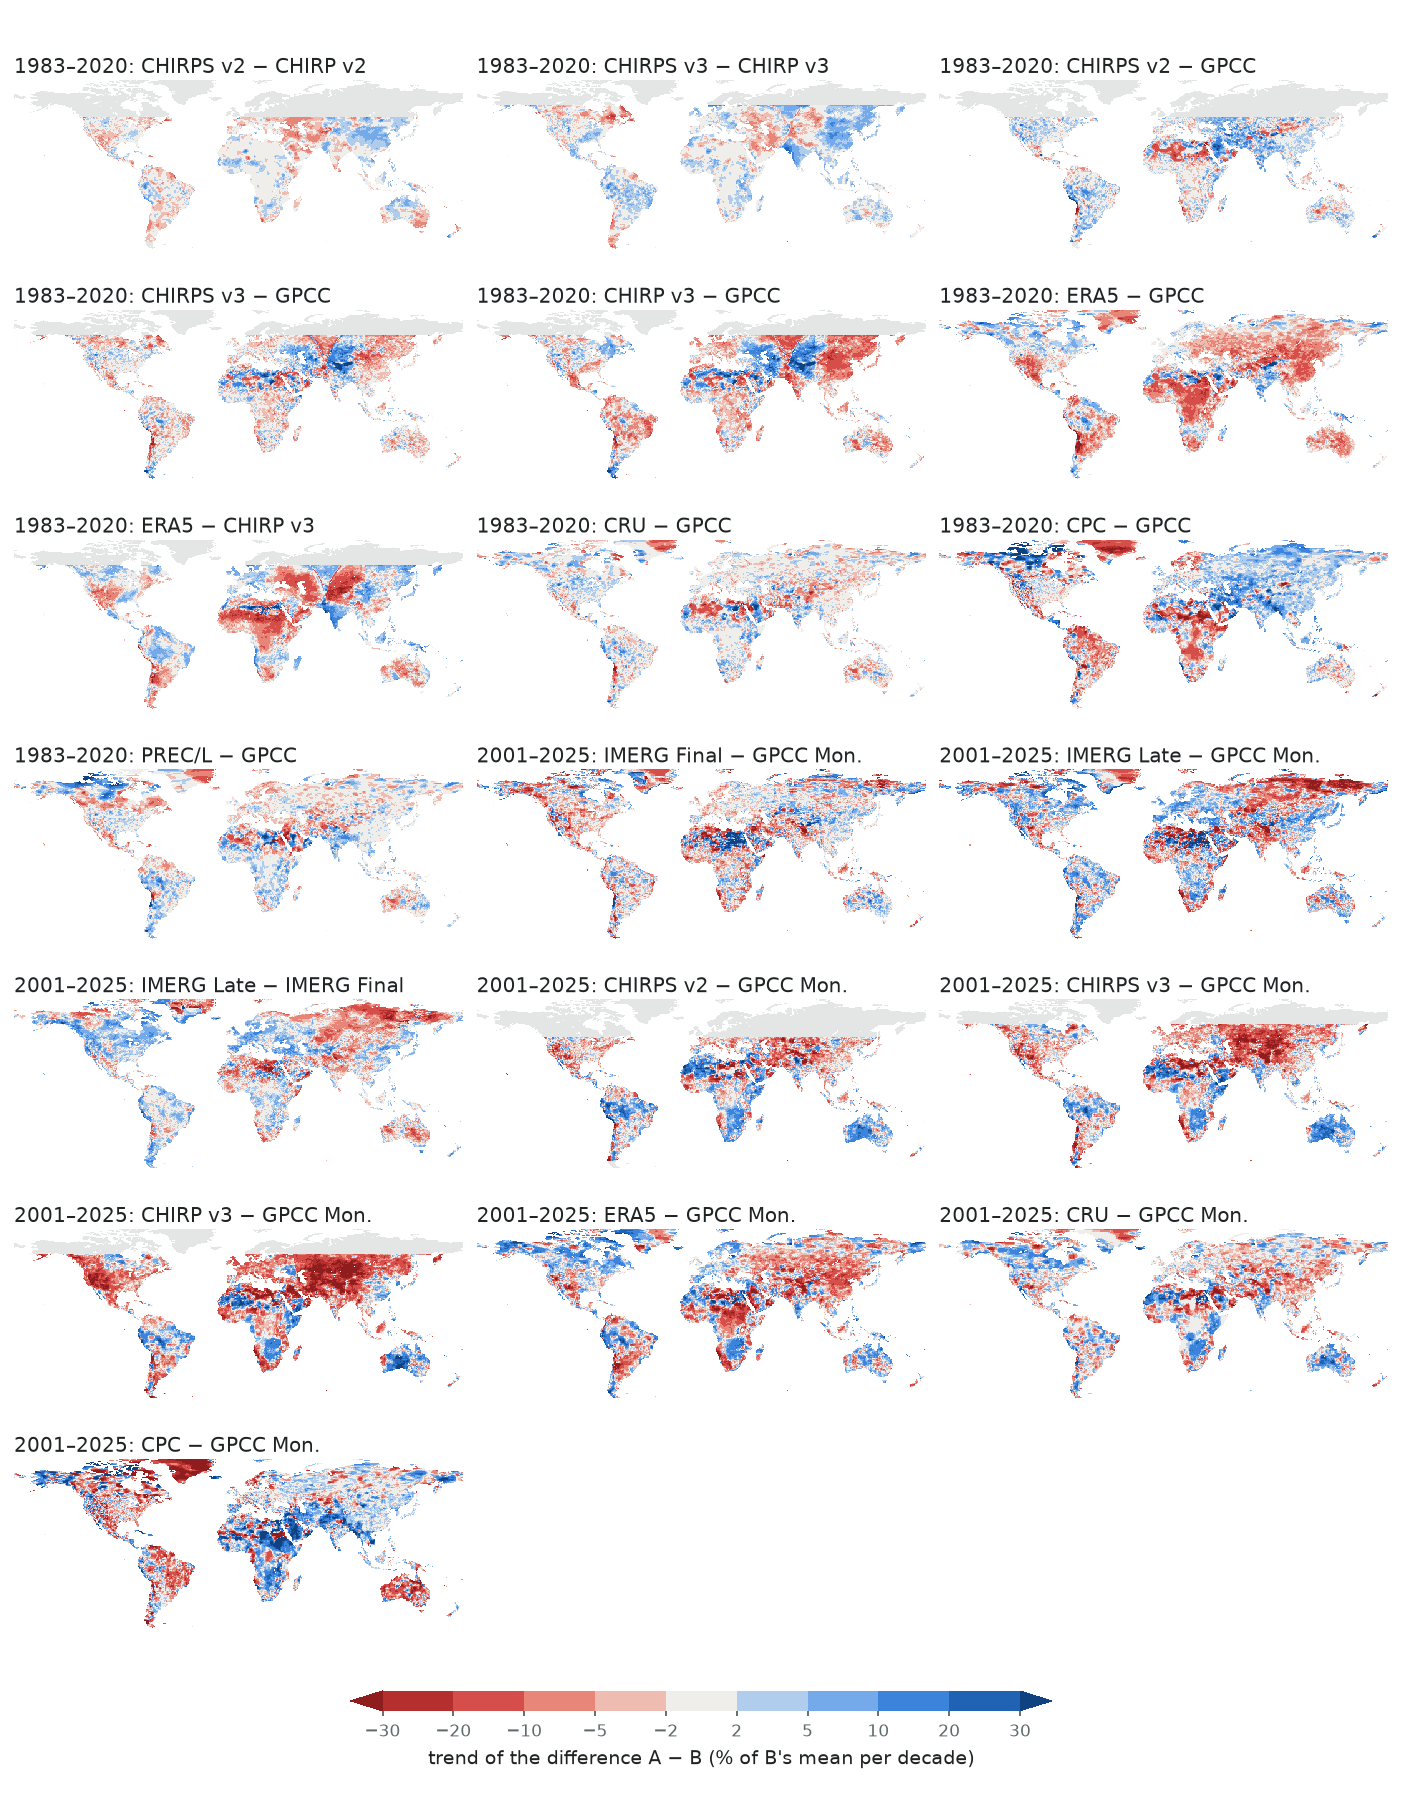
- ERA5 dries in Africa and arid climates — −5.3% per decade against GPCC there, and −3.3% against the gauge-free CHIRP v3 too, so in those regions it is ERA5 drifting, not the gauges. Globally the picture is ambiguous: ERA5 − GPCC is −2.3% per decade (significant in 29% of cells but not for the regional series) and CHIRP v3 − GPCC is the same −2.3%, which would equally fit GPCC getting wetter. ERA5's ratio to GPCC fell from 1.14 (1983–2000) to 1.08 (2001–2020).
- CHIRPS v2 gets wetter relative to GPCC (+1.2% per decade), from its satellite part: CHIRPS v2 − CHIRP v2 has no trend.
- CHIRPS v3's stations add a wetting trend to CHIRP v3 (+1.8% per decade, the most significant difference on the page), bringing it in line with GPCC (−0.5%, not significant).
- CHIRP v3 and CHIRPS v3 have a meridional seam near 72°E in Central and South Asia: drying against GPCC in a band at about 64–72°E and wetting on both sides of it, following the meridian across national borders. It is present in the station-free CHIRP v3 and absent from ERA5 and CRU against GPCC, so it comes from CHIRP v3's satellite inputs; its cause is not established. Treat CHIRPS v3 trends in that region with caution.
- CPC is unstable: relative to GPCC it trends +5.6% per decade in Asia and −5.1% in South America (1983–2020), and since 2001 its own trends reach +13% and −11% per decade there. Do not use it for trends.
- Globally, the 7% of the area that had a GPCC gauge every year shows a similar GPCC trend (+0.7% per decade) to all cells (+0.5%) and gauge-free cells (+0.8%), so the shrinking network does not appear to drive GPCC's own global trend.
- The operational IMERG Late run is noisier than the Final run that backtests often use, and has drifted. Triple collocation, which does not reward Final for its calibration to GPCC, gives Late ρ² 0.61 against Final's 0.85; dry-tercile skill against GPCC is 0.42 against 0.68. Late ÷ Final was 1.00 for 2001–2021 and 1.05 for 2022–2025. The team's archive also still holds NASA's corrupted values from 17 October – 2 November 2024 (daily totals up to 4,000 mm); that period is masked here and should be in any IMERG Late analysis.
- The ASAP rainfall blend is CHIRPS v2 between 50°S and 50°N, so it inherits CHIRPS v2's results, including its wetting drift relative to the gauges.
Products
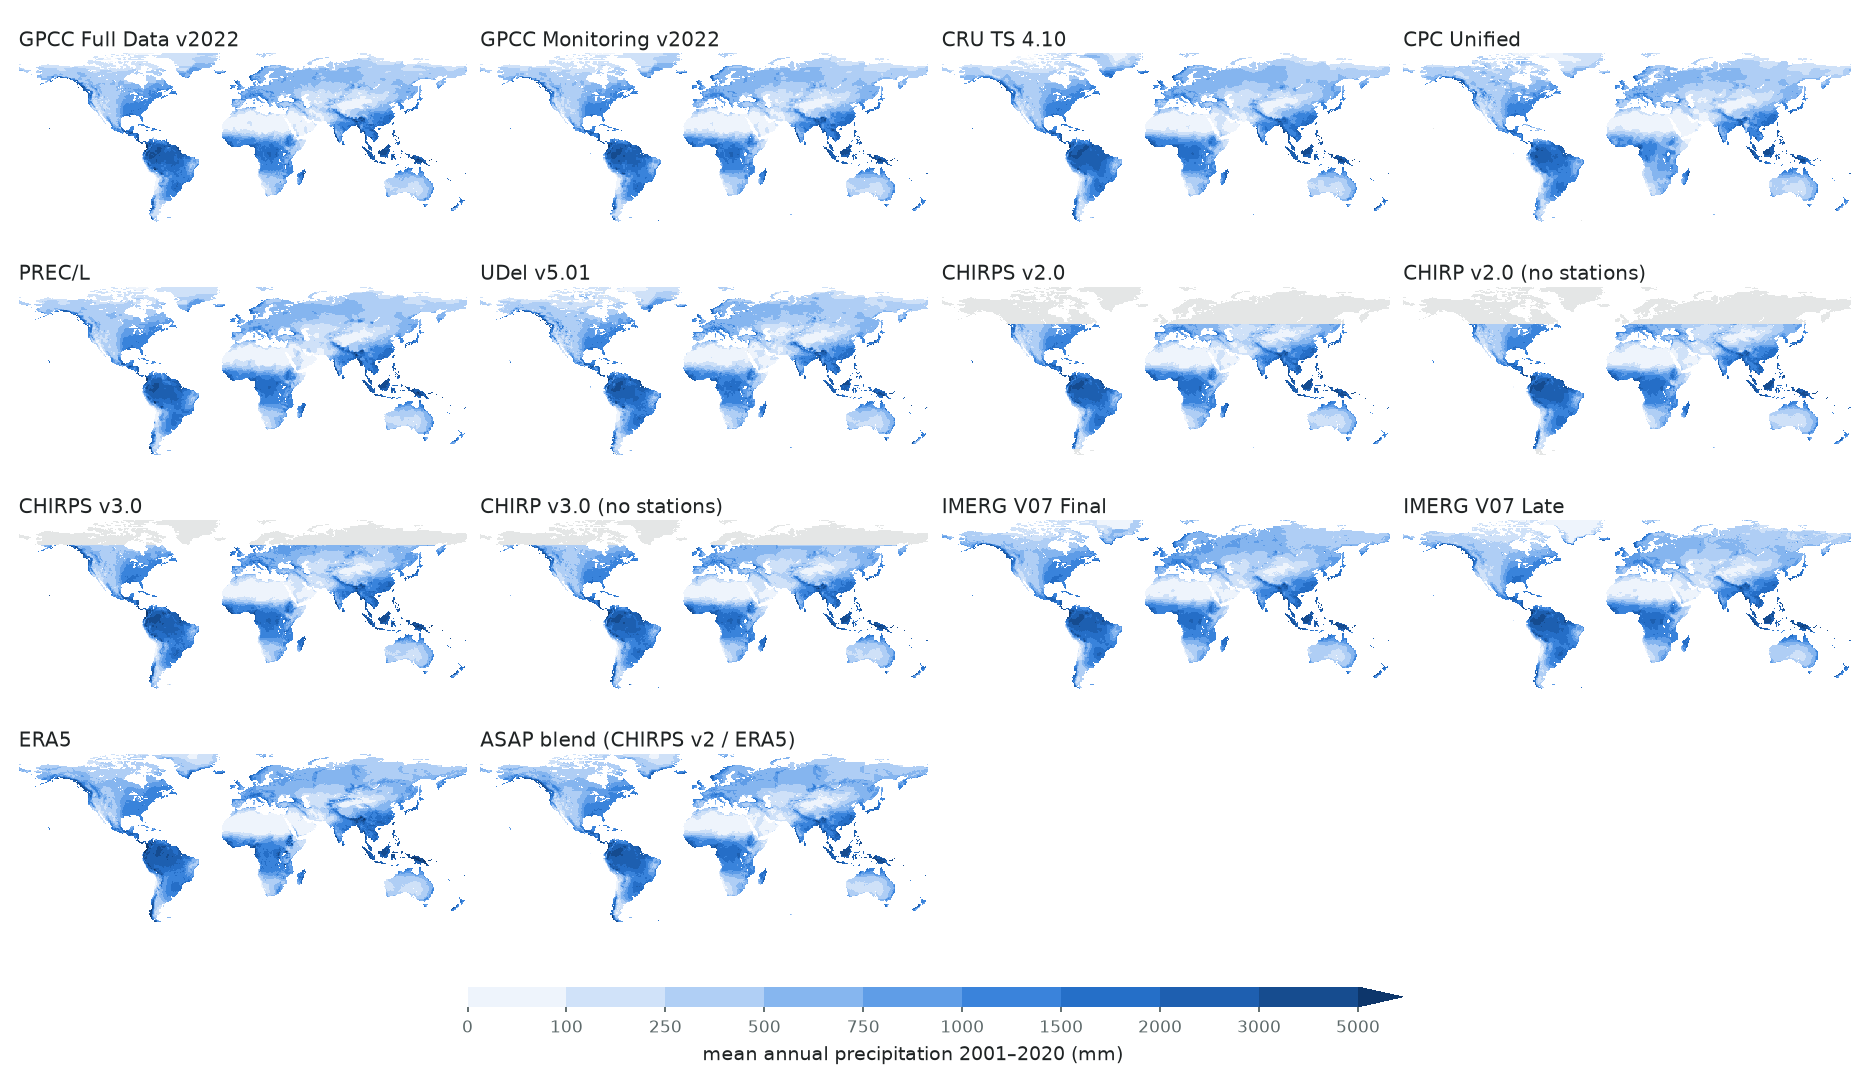
All products are converted to monthly totals (mm) on a common 0.5° grid and compared over land between 60°S and the pole (Antarctica excluded). Cross-product statistics use the cells every product covers (CHIRPS v2 limits this to 50°S–50°N); maps show each product on its own domain. Line styles below are used in every chart: the same colour is one product family, a dashed line its station-free or near-real-time sibling.
How many gauges stand behind each number
Every gauge-based product — and every satellite product calibrated or blended with gauges — is only as good as the station network under it, and that network is neither even nor stable. Most results on this page are therefore split by how often the 0.5° cell had at least one GPCC gauge in 2001–2020: never gauged, gauged in under half of the months, gauged in at least half. In never-gauged cells GPCC itself is an interpolation from neighbouring cells, so "agreement with GPCC" there is two estimates agreeing, not skill. (Classing by the median gauge count would call most cells ungauged: GPCC's network shrinks so much after 2010 that cells gauged for a decade fall to zero.)
Network size over time
GPCC Monitoring counts are for its 1° cell, repeated to the four 0.5° cells inside it. CRU counts stations within its correlation-decay distance, not inside the cell; where none are in range CRU relaxes to its 1961–90 climatology, which by construction carries no anomaly and no trend.
Relative bias
Bias is the ratio of totals over 2001–2020 (Σ product ÷ Σ reference, paired months), area-weighted within a region. Cells where GPCC's climatology is below 50 mm/year are left out of relative measures. The reference here is GPCC Full Data — not because it is truth, but because it is the densest gauge analysis; the pairwise matrix below gives the same comparison against every other product, including the two that use no gauges at all (CHIRP and ERA5).
Every product against every other
Is CHIRPS v3 wetter because of undercatch correction?
CHIRPS v3 corrects its station data for wind-induced gauge undercatch (Legates–Willmott factors); CHIRPS v2 and the gauge analyses do not. If the v3/v2 difference is the correction, the cell-level v3/v2 ratio should follow the correction factor.
Agreement on monthly anomalies
Bias says whether a product is wetter or drier on average; for triggers what matters more is whether it gets the anomalies right — which months are unusually wet or dry. Each product's months are converted to standardised anomalies against its own 2001–2020 climatology (calendar month by calendar month), restricted to months where GPCC's climatology is at least 10 mm, and correlated with GPCC's (Spearman). The variability ratio compares the size of the anomalies.
Pairwise
Triple collocation: error without a reference
Comparing against GPCC rewards products that share GPCC's stations. Triple collocation (extended form, McColl et al. 2014) instead estimates, for three products with mutually independent errors, how well each correlates with the unknown truth. Each product is paired with two partners chosen so their errors are plausibly independent of it (bracketed). Assumptions are imperfect — CHIRP's climatology uses GPCC station normals (anomalies largely remove this), IMERG Final and CHIRP share infrared inputs — so read differences of a few hundredths as ties. Sampling noise pushes some cell estimates outside 0–1; they are clipped to the bound before taking medians.
Do products agree on dry terciles?
Anticipatory-action drought triggers are usually percentile-based: a season in the bottom third of its own history. Each month (or 3-month total, SPI-3-like) is classed dry / normal / wet against the product's own 2001–2020 distribution. The table scores dry-tercile detection against GPCC: hit rate (share of GPCC's dry seasons the product also calls dry), false-detection rate (share of GPCC's non-dry seasons the product calls dry), and the Peirce skill score PSS = hit rate − false-detection rate (0 = no skill, 1 = perfect). The false-alarm ratio is the share of the product's own dry calls that GPCC does not call dry — the number to read as "how often a trigger on this product would fire wrongly". Only months where GPCC's climatology is at least 10 mm (30 mm for 3-month totals) are scored. The "GPCC's climatology" variant classes the product's values against GPCC's thresholds instead, which is where a mean bias starts to bite. With 20 years per calendar month, single-cell scores are noisy; regional values pool all cells and months.
Pairwise (3-month, own climatology)
Trends
Sen's slope of annual totals with a Mann–Kendall test corrected for autocorrelation, as % of the mean per decade, for 1983–2020 (long-record products) and 2001–2025 (adds IMERG and GPCC Monitoring; GPCC Full Data ends in 2020). Maps fade cells that are not significant after false-discovery-rate control (Benjamini–Hochberg, q = 0.1). Regional values use the area-weighted regional annual series.
Trends of the difference between two products
A trend in product A minus product B removes the climate signal both share and isolates how the two drift apart — the most sensitive test of an artefact. CHIRPS − CHIRP isolates what the station blending adds; ERA5 − GPCC and CHIRP − GPCC compare the two gauge-independent axes against the gauge network.
Drift and breaks
Annual totals divided by the reference's, by region. A flat line at a constant ratio is a stable bias; a slope or a step is drift — in the product, the reference, or both.
The operational IMERG Late run against IMERG Final
The team's triggers read IMERG Late — available within a day, but without the monthly gauge calibration that Final gets months later. Below: Late ÷ Final, month by month, over the common domain, from the team's own daily archive. The spike in October 2024 is a documented NASA incident: corrupted GPM Core calibration data produced unrealistically high Early and Late values from 17 October until repaired calibration files were applied on 2 November 2024 (IMERG V07 release notes). The archive still holds those values — daily maxima of 1,000–4,000 mm — so anything computed from IMERG Late for those weeks is wrong. October and November 2024 are excluded from every other IMERG Late statistic on this page.
Step tests at known changes
By country
Country values are area-weighted over the 0.5° land cells assigned to the country (majority of the cell; countries with fewer than 3 cells are omitted). Click a row for its annual series and seasonal cycle. Trend markers: • = p < 0.05.
Methods and caveats
Data and regridding
- Every product is converted to monthly totals in mm and put on one 0.5° grid. Grids that nest inside 0.5° cells (CHIRPS 0.05°, IMERG 0.1°, the 0.5° gauge analyses) are block-averaged exactly; GPCC Monitoring's 1° cells are repeated into their four 0.5° cells; ERA5's 0.25° grid is point-centred, so each 0.5° cell takes its centre point at weight ½ and the neighbours at ¼ in each direction. CHIRPS cells with fewer than half their 0.05° pixels valid (coasts) are dropped.
- IMERG Late is summed from the team's daily operational archive (V07 Late, 1998 onward); a month counts only if every day is present. CPC's record (as served by NOAA PSL) is missing single days globally in several months — 1981–1992 outside the Americas, February 2007 — so CPC months with at most two missing days are scaled to the full month (total × days in month ÷ valid days).
- The ASAP blend reproduces the JRC ASAP rainfall input as documented: CHIRPS v2 within 50° of the equator, ERA5 beyond (ASAP also uses ECMWF HRES for the latest days, which a monthly archive cannot reproduce; whether ASAP has since moved to CHIRPS v3 is not documented). Inside the 50°S–50°N common domain the blend is CHIRPS v2, so it only differs in the poleward latitude-band results.
- Land = Natural Earth 10 m land minus lakes covering ≥ 50% of the cell, Antarctica excluded (61k cells). Cross-product statistics use the cells every product covers; maps show each product on its own domain. All regional statistics are area-weighted (cos latitude × land fraction).
- Every product passed an automated fingerprint check before use (desert, rainforest, Sahel, southern Africa and England annual totals and peak months), which catches unit, orientation and one-month time-stamp errors.
Choices that shape the results
- Reference. GPCC Full Data is the reference for "bias", not truth. No ensemble median is used: most products share GPCC's or GHCN's stations, so a median of them is anchored to the same network and would flag the station-free products (CHIRP, ERA5) as outliers by construction.
- Shared inputs. IMERG Final is calibrated to GPCC monthly over land (Full Data to 2020, Monitoring from 2021), so its agreement with GPCC is partly circular. CHIRPS v3's climatology incorporates GPCC station normals. CRU, CPC, PREC/L, UDel and GPCC share GHCN/CLIMAT stations. The station-free axes are CHIRP and ERA5.
- Undercatch. Gauges miss part of the rain and much of the snow (wind). CHIRPS v3 corrects its stations for this; GPCC Full Data, CRU, CPC, PREC/L and UDel do not; ERA5 is model rainfall with no undercatch at all. The headline bias is therefore also shown for rain months only (CRU temperature ≥ 2 °C), where the correction is 5–10%, and with all gauge products lifted by the Legates–Willmott factors as a sensitivity — not as a "true" footing.
- Ratios, not mean ratios. Relative bias is Σ product ÷ Σ reference over paired months, which stays finite in dry places; cells with < 50 mm/year in GPCC are excluded from relative measures.
- Trends. Sen's slope with a Mann–Kendall test whose variance is inflated for lag-1 autocorrelation (AR(1) effective sample size with small-sample bias correction; simulated false-positive rate 4–7% at nominal 5%). Field significance by Benjamini–Hochberg at q = 0.1 (Wilks 2016). 38 years of annual totals detect roughly ≥ 10% per decade; 25 years, far less — a non-significant trend is "not detectable", not "no trend". Difference series (A − B) remove the shared climate signal and are far more sensitive to artefacts.
- Network change. GPCC's station count falls sharply in recent years, CRU relaxes to climatology where it has no stations, CPC changed its network in 2006, IMERG switched from TRMM-era to GPM-era inputs in 2014 and its gauge calibration source in 2021. The drift and step sections test each.
- Terciles. 20 years per calendar month is short; terciles are estimated per cell and calendar month, and scores are pooled over cells and months. SPI-style 3-month totals on a 20-year base are below the WMO-recommended 30.
Sources
CHIRPS/CHIRP v2.0 and v3.0 (Climate Hazards Center, UCSB); IMERG V07 Final monthly (NASA GES DISC, GPM_3IMERGM) and Late daily; ERA5 monthly total precipitation (ECMWF/Copernicus); GPCC Full Data Monthly v2022 and Monitoring Product v2022 (DWD); CRU TS 4.10 (UEA, Open Database Licence — derived statistics only); CPC Global Unified Gauge-Based Analysis, PREC/L and UDel v5.01 (NOAA PSL); Legates–Willmott undercatch factors as distributed by CHC; Köppen–Geiger 1991–2020 (Beck et al. 2023, CC BY 4.0); Natural Earth. Code: OCHA-DAP/ds-precip-intercomparison.