Eritrea · Kiremti season · June to August 2026

How Eritrea's 2026 rainy season is going

The June to August rains were among the poorest Eritrea has had since records began in 1981. Vegetation is falling fast after a good start to the year, and the dry area grew through the season.

71%of the 1989–2018 average, June to August
3rd driestsince 1981, after 1984 and 1990

Updated 24 September 2026 · September rainfall is still preliminary

Rainfall

This season is one of the driest on record. Every region got well below its normal rainfall from June to August. Since 1981, only 1984 and 1990 were drier across the country, and 1991 was about as dry. This isn't a patchy or local shortfall: the whole country missed out on its main rains.
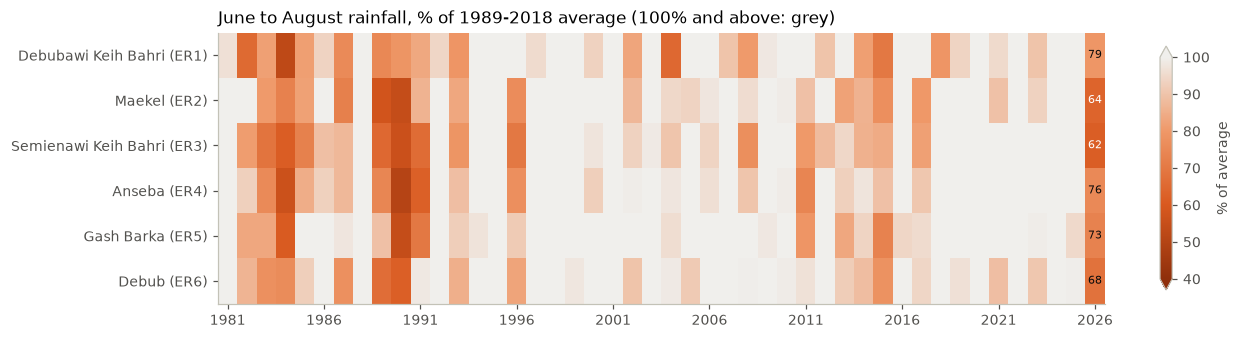
Heatmap of June to August rainfall as a percentage of the 1989 to 2018 average for each of Eritrea's six regions, 1981 to 2026. 2026 is shaded well below average in every region: 79% Debubawi Keih Bahri, 64% Maekel, 62% Semienawi Keih Bahri, 76% Anseba, 73% Gash Barka, 68% Debub.
Figure 1June to August rainfall by region, as a share of the 1989–2018 average. Orange shades are below average; years at or above average are grey.
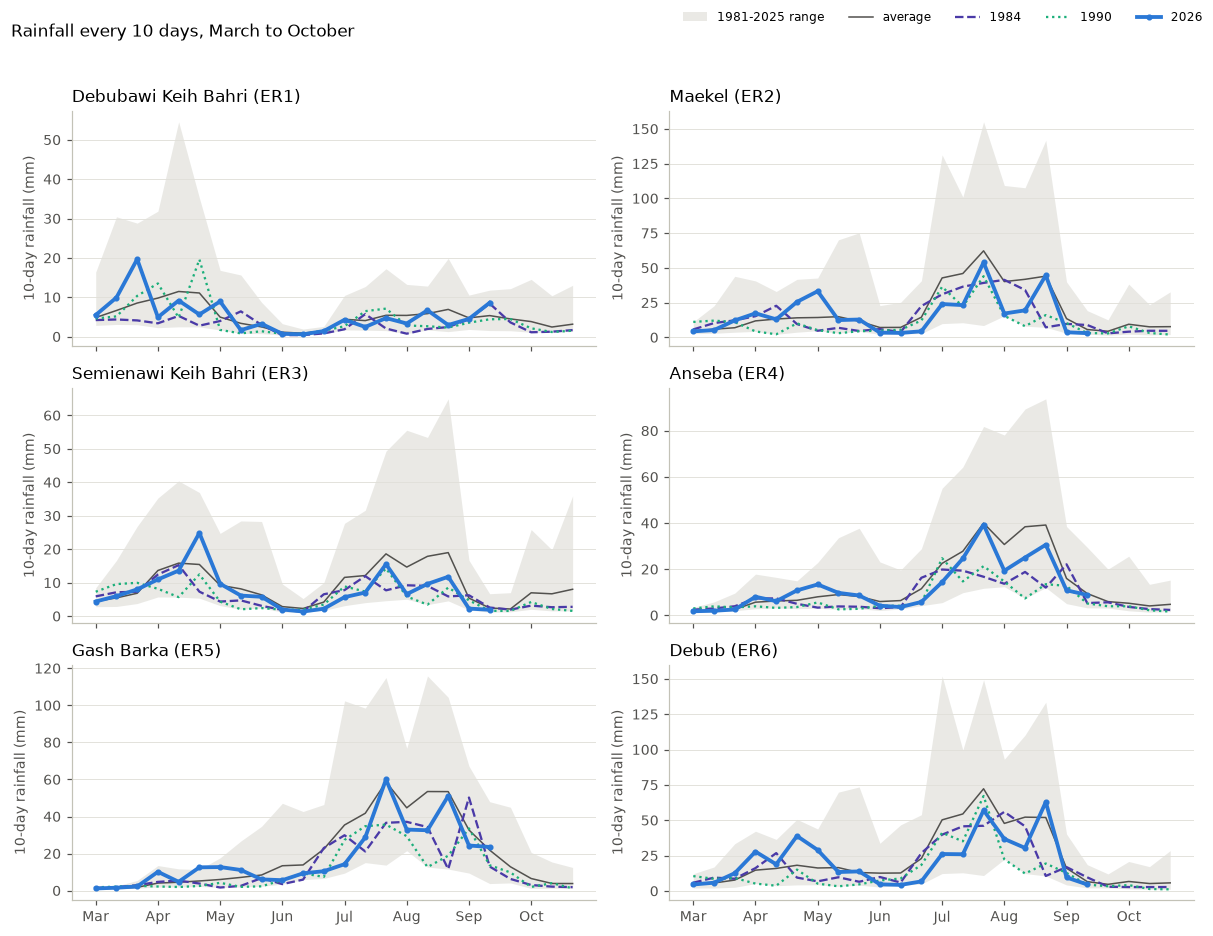
Six panels, one per region, of rainfall every 10 days from March to October. The 2026 line sits below the average line through most of June to August in every region, alongside the 1984 and 1990 seasons and the 1981 to 2025 range.
Figure 2Rainfall every 10 days, March to October. 2026 (blue) against the two driest June to August seasons on record, 1984 and 1990. The grey band is the range of 1981–2025.

Vegetation

Above-normal rains from March to May boosted vegetation early in the year, but the main June to August rains, which bring most of the year's rainfall, failed.

Vegetation peaked in early May and has fallen steadily since June. Some areas dropped below normal in late July, and more in late August. Other areas are still above normal but falling. The early-season greenness is running out, and the steady downward trend suggests conditions will keep getting worse over the coming weeks.
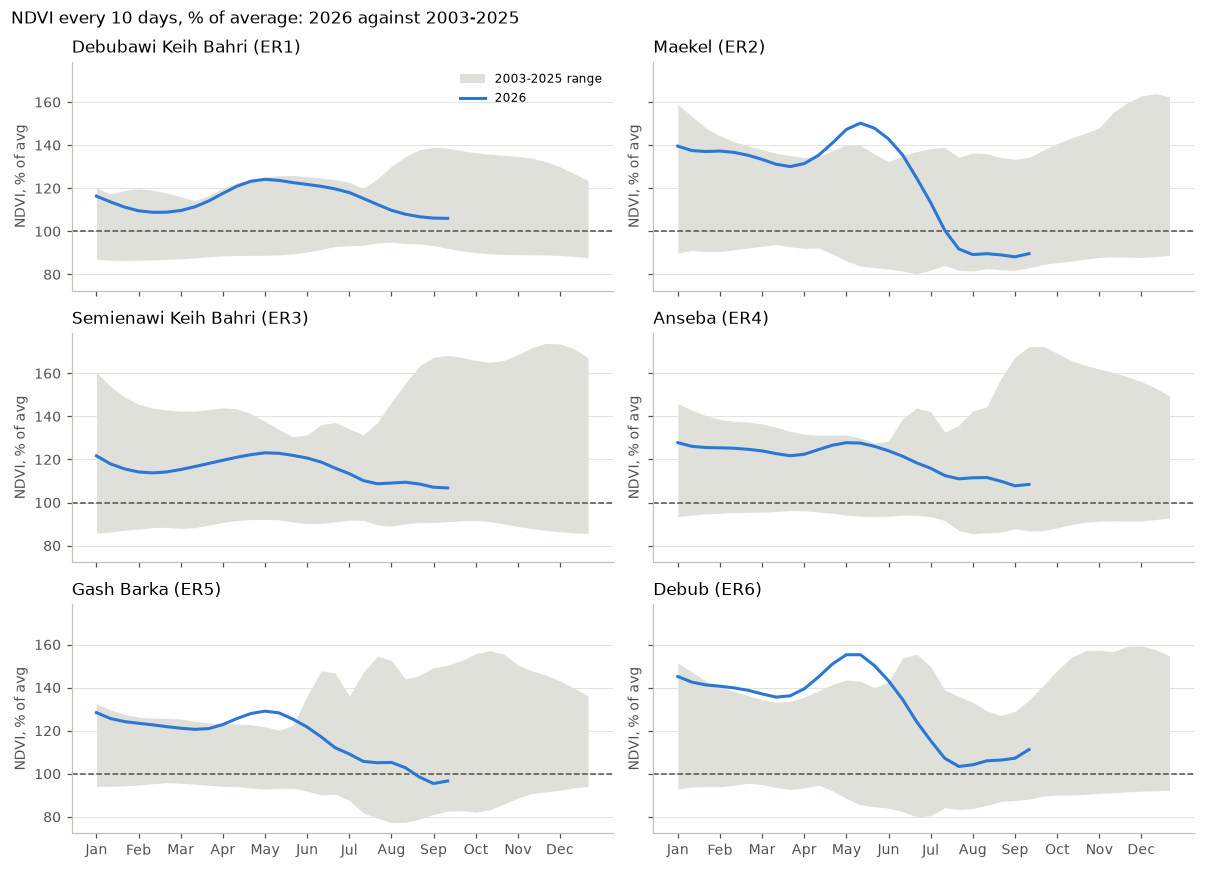
Six panels, one per region, of vegetation (NDVI) as a percentage of average every 10 days in 2026 against the 2003 to 2025 range. Every region peaks in May and declines from June; Maekel and Gash Barka fall below 100%.
Figure 3Vegetation (NDVI) every 10 days as a share of average: 2026 (blue) against the range of 2003–2025. The dashed line is average.

Drought indicator

ICPAC's monthly drought indicator is picking up the rainfall shortage in parts of all six regions. So far it only reflects the lack of rain over June to August, not a soil moisture deficit or an effect on vegetation, which is why it shows Watch only.

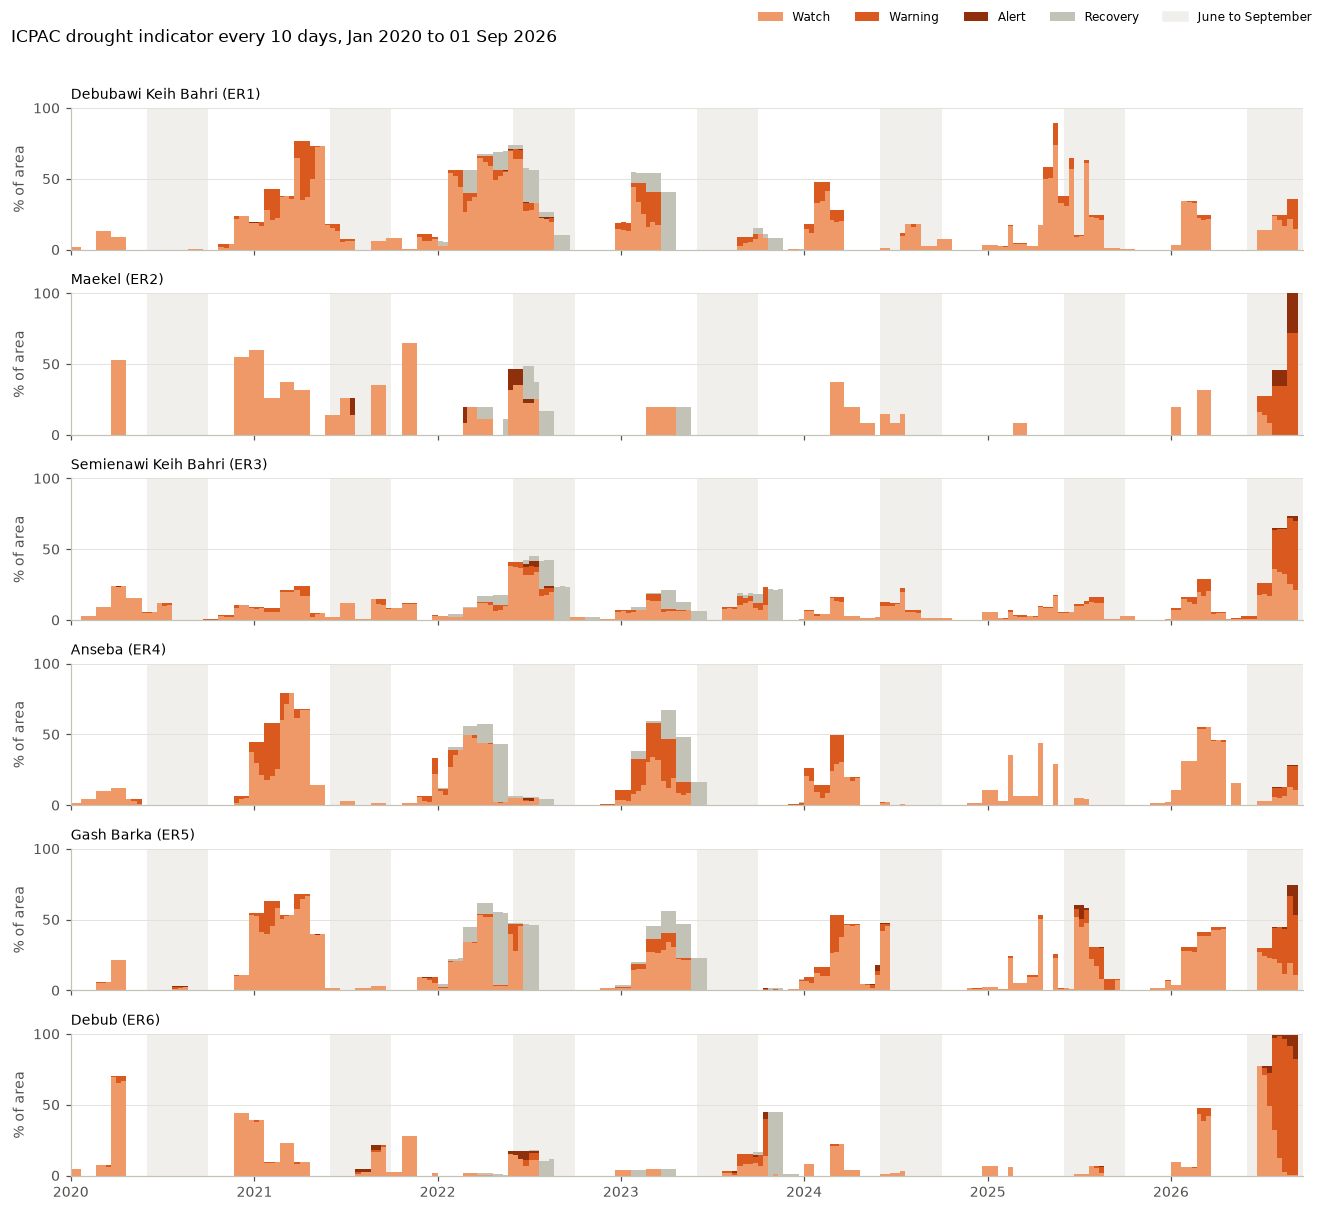
The 10-day version of the same indicator is further along. By the start of September, about half of Eritrea was at Warning (rainfall shortage plus a soil moisture deficit) or Alert (vegetation also affected), the most widespread since the 10-day records on HDX begin in 2020.
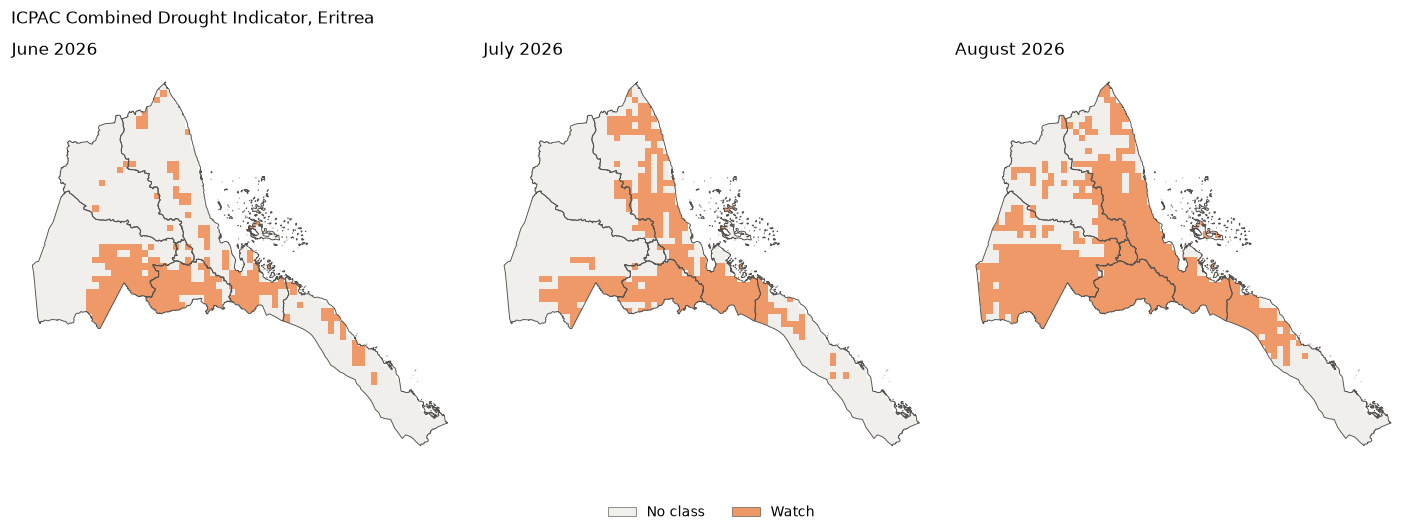
Three maps of Eritrea for June, July and August 2026 showing areas under Watch (rainfall shortage) in orange. The orange area grows each month, covering most of the south and centre by August. No area is at Warning or Alert.
Figure 4ICPAC monthly Combined Drought Indicator, June, July and August 2026. Watch means a rainfall shortage. In the monthly indicator, no part of Eritrea reached Warning (soil moisture also affected) or Alert (vegetation also affected).
Six stacked timelines, one per region, of the share of area at each drought indicator level every 10 days from January 2020 to September 2026, with June to September shaded each year.
Figure 5ICPAC drought indicator every 10 days, January 2020 to September 2026: share of each region's area at each level. The shaded bands mark June to September each year.