Cholera Trigger Analysis
Pauline N.
2026-03-02
Introduction
This document develops a country-level cholera alert system using WHO bulletin data, focusing on detecting significant increases in reported cases. The primary focus of this documentation is on Cameroon (CMR), Democratic Republic of the Congo (COD), Ethiopia (ETH), Mozambique (MOZ), Nigeria (NGA), and South Sudan (SSD), which are used for detailed visualization and comparison throughout the analysis.
Load Data
The dataset contains three separate columns for the start of the reporting period. These appear to represent the same date field recorded in different formats or versions. In most cases, only one of the three columns contains a value for a given record, while the others are NA. This suggests they are alternative fields rather than distinct variables, and they need to be consolidated into a single start date.
| Country | Event | Grade | Date notified to WCO | Start of reporting period | End of reporting period | Total cases | Cases Confirmed | Deaths | CFR | WeekNumber | Year | Month | Start of reporting period | End of reporting period | Start of reporting period | Unnamed: 10 | Date notified to WHO | YearWeek | WeekDate | Case Change |
|---|---|---|---|---|---|---|---|---|---|---|---|---|---|---|---|---|---|---|---|---|
| Angola | Poliomyelitis (cVDPV2) | Grade 2 | 8-May-19 | 5-Apr-19 | NA | 71 | 71 | 0 | 0.0 | 5 | 2020 | 5 | NA | 22-Jan-20 | NA | NA | NA | 2020-5 | 2020-01-29 | NA |
| Benin | Dengue fever | Ungraded | 13-May-19 | 10-May-19 | NA | 26 | 14 | 2 | 7.7 | 5 | 2020 | 5 | NA | 29-Nov-19 | NA | NA | NA | 2020-5 | 2020-01-29 | NA |
| Benin | Meningitis | Ungraded | 6-Jan-20 | 9-Dec-19 | NA | 83 | 24 | 13 | 15.7 | 5 | 2020 | 5 | NA | 22-Jan-20 | NA | NA | NA | 2020-5 | 2020-01-29 | NA |
| Benin | Poliomyelitis (cVDPV2) | Grade 2 | 8-Aug-19 | 8-Aug-19 | NA | 6 | 6 | 0 | 0.0 | 5 | 2020 | 5 | NA | 22-Jan-20 | NA | NA | NA | 2020-5 | 2020-01-29 | NA |
| Burkina Faso | Humanitarian crisis | Grade 2 | 1-Jan-19 | 1-Jan-19 | NA | 0 | 0 | 0 | 0.0 | 5 | 2020 | 5 | NA | 27-Jan-20 | NA | NA | NA | 2020-5 | 2020-01-29 | NA |
Clean and Prepare Data
This step prepares the raw WHO bulletin data for analysis. It standardizes column names, keeps only confirmed cholera records, and selects the key variables (country, dates, cases, deaths, and CFR). The multiple start-date fields are consolidated into a single date, and the data are aggregated to one row per country per week. The time series is then ordered chronologically and missing case values are interpolated to create a continuous dataset for alert calculations.
| iso3 | date | event | start_date | cholera_cases | cholera_cfr | deaths |
|---|---|---|---|---|---|---|
| AGO | 2025-01-22 | Cholera | 2025-01-07 | 58 | 8.6 | 5 |
| AGO | 2025-01-29 | Cholera | 2024-12-31 | 1216 | 3.9 | 48 |
| AGO | 2025-02-05 | Cholera | 2024-12-31 | 3043 | 3.3 | 101 |
| AGO | 2025-02-12 | Cholera | 2024-12-31 | 4107 | 3.8 | 147 |
| AGO | 2025-02-19 | Cholera | 2024-12-31 | 4914 | 3.7 | 180 |
First, we check whether reported case counts generally increase over time within each country. Since most values are greater than or equal to the previous week (with the lowest proportion close to 90%), this strongly suggests the series represents cumulative case counts rather than weekly incident cases.
| iso3 | mean(rising_cases, na.rm = TRUE) |
|---|---|
| AGO | 0.8571429 |
| BDI | 0.9096774 |
| BEN | 0.9622642 |
| BFA | 1.0000000 |
| CIV | 1.0000000 |
Additional Data Cleaning
- The weekday associated with the reporting date varies across records.
- Week definitions are not fully consistent across years and may shift within a year.
- Most reporting dates fall between Monday and Wednesday.
- Attempts to fill missing values revealed inconsistencies in how weeks are defined.
- Very small values (e.g., 1) and decimal values—particularly those surrounded by much larger numbers—are reviewed and corrected where appropriate.
- Missing weeks are filled to maintain a continuous time series.
| date | event | start_date | cholera_cases | cholera_cfr | deaths | prev_date_diff |
|---|---|---|---|---|---|---|
| AGO | ||||||
| 2025-01-22 | Cholera | 2025-01-07 | 58 | 8.6 | 5 | NA |
| 2025-01-29 | Cholera | 2024-12-31 | 1216 | 3.9 | 48 | 7 |
| 2025-02-05 | Cholera | 2024-12-31 | 3043 | 3.3 | 101 | 7 |
| 2025-02-12 | Cholera | 2024-12-31 | 4107 | 3.8 | 147 | 7 |
| 2025-02-19 | Cholera | 2024-12-31 | 4914 | 3.7 | 180 | 7 |
Weekly Check
This step checks how complete the weekly data are for each country.
First, the year is extracted from the reporting date. The data are then grouped by country and year to count how many reporting weeks are available in each year. Finally, for each country, the minimum, maximum, and average number of reporting weeks per year are calculated.
| iso3 | min_weeks | max_weeks | mean_weeks |
|---|---|---|---|
| AGO | 2 | 34 | 18.0 |
| BDI | 2 | 51 | 26.0 |
| BEN | 1 | 23 | 13.5 |
| BFA | 7 | 13 | 10.0 |
| CIV | 13 | 13 | 13.0 |
This check looks for reporting entries that occur unusually close together. It flags rows where the gap between a country’s current reporting date and the previous one is less than 7 days, then counts how often this happens per country.
| iso3 | count |
|---|---|
| AGO | 1 |
| BDI | 1 |
| CMR | 1 |
| COD | 2 |
| COM | 1 |
Global Cholera Trigger Options:
Several alert strategies are evaluated to determine which approach most effectively identifies meaningful surges in cholera cases.
DRC Trigger Approach
A high-level alert is issued if elevated transmission is sustained for three consecutive weeks. Level 3 is defined as either:
A fourfold increase compared to a baseline level, or
A value exceeding the 99th percentile of historical observations.
Legacy Cumulative Methodology (Signals System)
This approach uses cumulative case counts and predefined thresholds, consistent with the earlier Signals methodology.
Signals “Highest Value” Methodology
An alert is triggered when the current weekly value exceeds any value observed in the previous 12 months, identifying new local peaks.
Three-Year Rolling Average Method
Weekly increases are compared to a rolling three-year historical average to detect deviations from longer-term trends.
In addition to case-based triggers, the potential inclusion of case fatality rate (CFR) and reported deaths is explored to assess whether severity indicators improve alert performance.
CERF Allocation Years
This section identifies the years in which each country received a CERF allocation related to cholera. These years are later used as reference points to assess how well the different alert methods align with funding decisions.
| iso3 | Year |
|---|---|
| AGO | 2025 |
| CMR | 2022 |
| CMR | 2020 |
| COM | 2024 |
| COD | 2025 |
Methodology 1: Percentile-Based Weekly Increase (Non-Cumulative Adjustment)
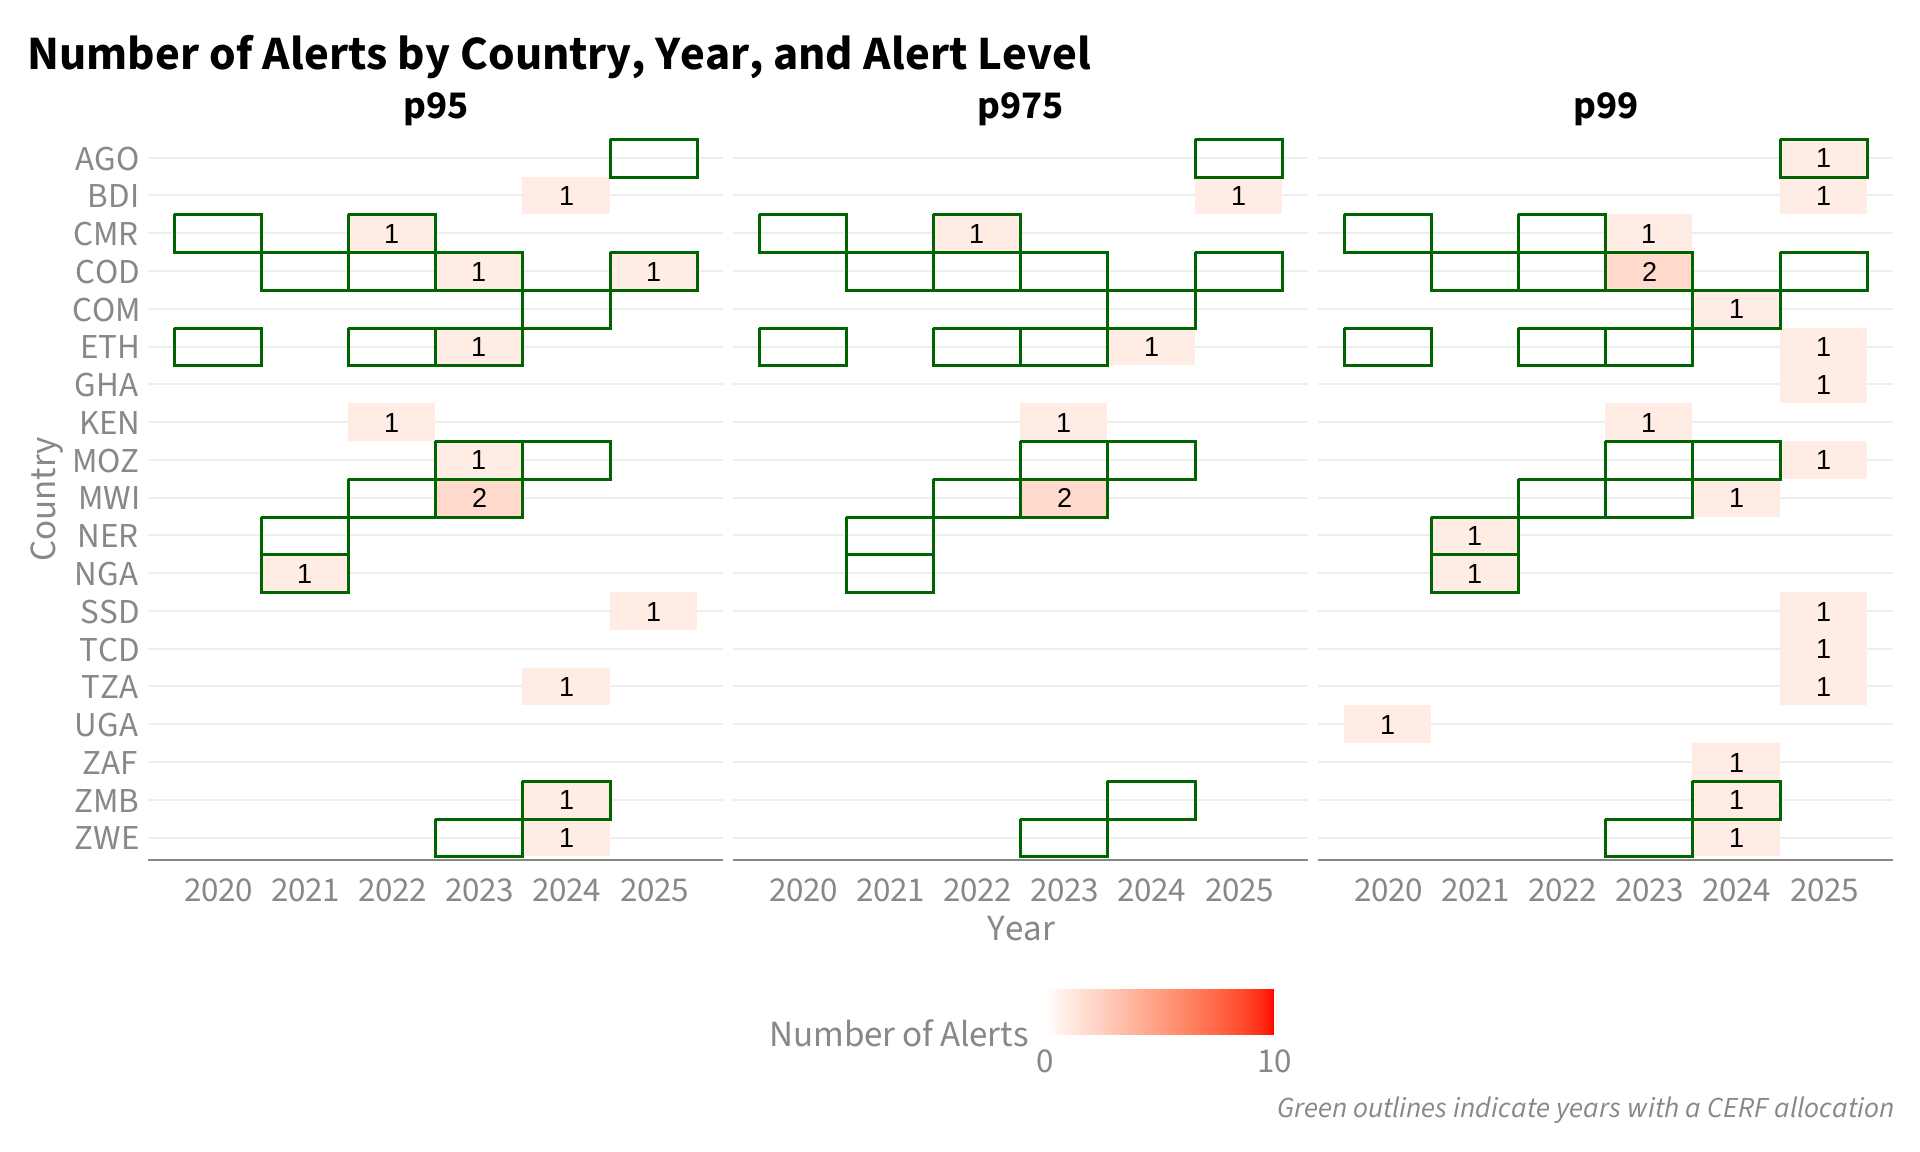
This approach assumes that reported values remain constant in weeks without new data until updated. The cumulative case series is converted into weekly increases, and alerts are triggered when increases exceed high historical percentiles (e.g., 95th, 97.5th, or 99th).
Comparison with CERF allocations
This section checks how well Method 1 alerts align with CERF cholera allocations. For each alert, the nearest CERF allocation date in the same country is identified and the time difference (in days) is calculated. Alerts are then counted as “aligned” if a CERF allocation occurs within a window of 30 days before to 90 days after the alert, focusing only on larger signals (≥ 1,000 new cases) and excluding non-alert weeks. The summary shows, by alert level (p95/p97.5/p99), the number of alerts and the proportion that fall within the CERF window.
In this case, the resulting dataset is empty, indicating that no alerts met both the case threshold and the defined CERF timing window.
| iso3 | date | event | start_date | cholera_cases | cholera_cfr | deaths | prev_date_diff | weekly_increase | p95 | p975 | p99 | year | alert_level | fold_increase | country_alloc_dates | nearest_allocation_date | time_diff_days | n_window |
|---|
Methodology 2: Cumulative Threshold-Based Trigger
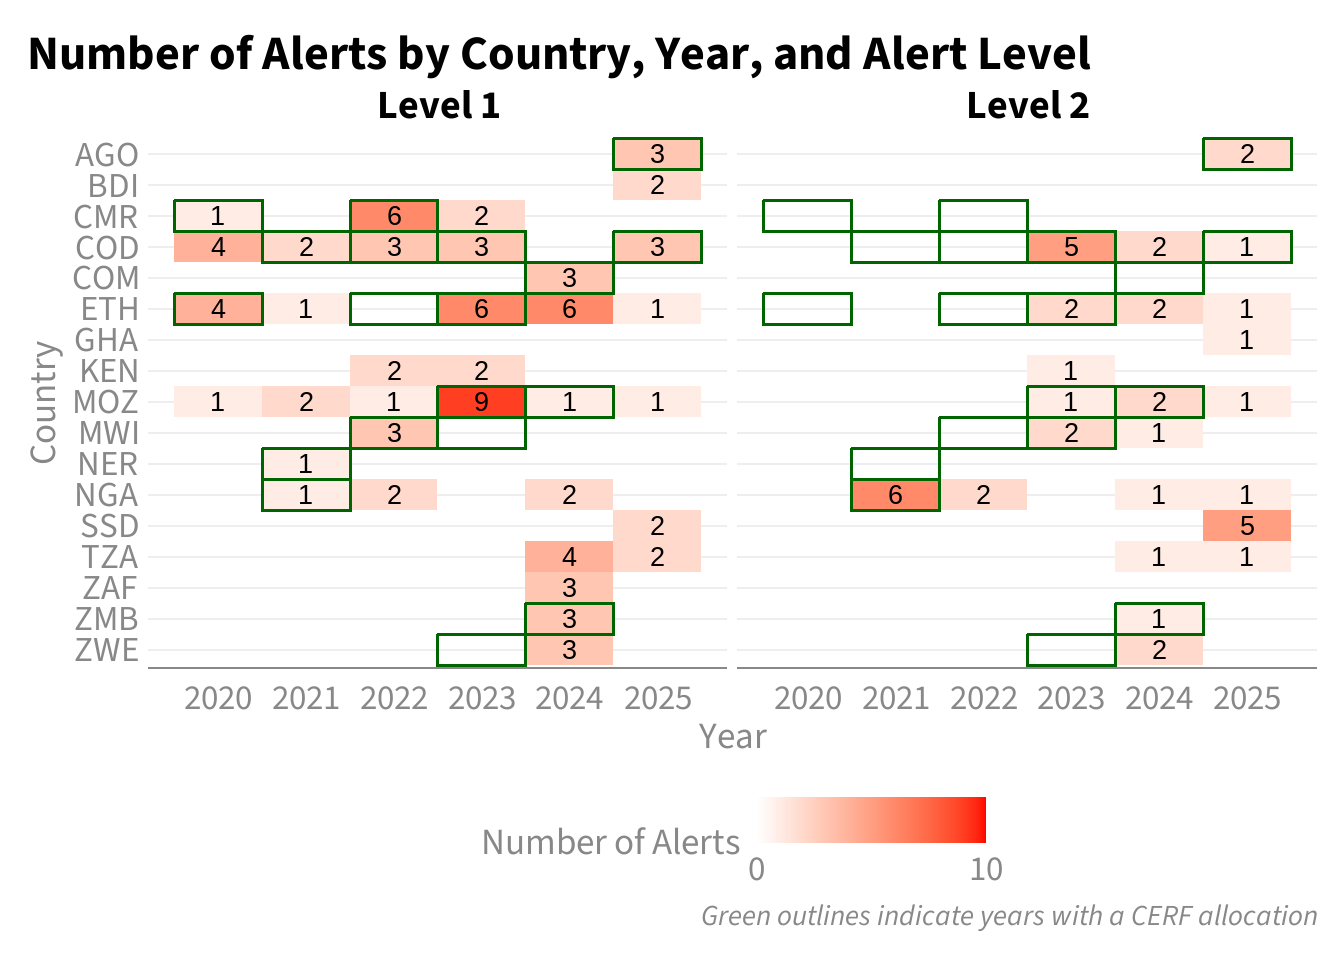
This approach uses cumulative case counts rather than percentiles. Weekly increases are derived from the cumulative series, and alerts are triggered when predefined absolute thresholds are crossed. Specifically, a Level 1 alert is issued when weekly increases exceed 1,000 cases, and a Level 2 alert is issued when increases exceed 5,000 cases. Alerts are only counted when a threshold is newly crossed, preventing repeated signals at the same level during sustained high transmission.
Comparison with CERF allocations
This section evaluates how well Method 2 alerts align with CERF cholera allocations. For each alert, the nearest CERF allocation date in the same country is identified and the time difference (in days) is calculated. Alerts are then counted as “aligned” if a CERF allocation occurs within a window of 60 days before to 90 days after the alert, focusing on signals that meet or exceed the Level 1 threshold (≥ 1,000 new cases). The summary shows, by alert level (Level 1/Level 2), the number of alerts and the proportion that fall within the CERF window. In this case, 133 alerts were generated under Method 2, but none occurred within the defined timing window.
| n | n_window | prop_window |
|---|---|---|
| 139 | 0 | 0 |
Methodology 3: Peak-in-12-Months with Alert Spacing
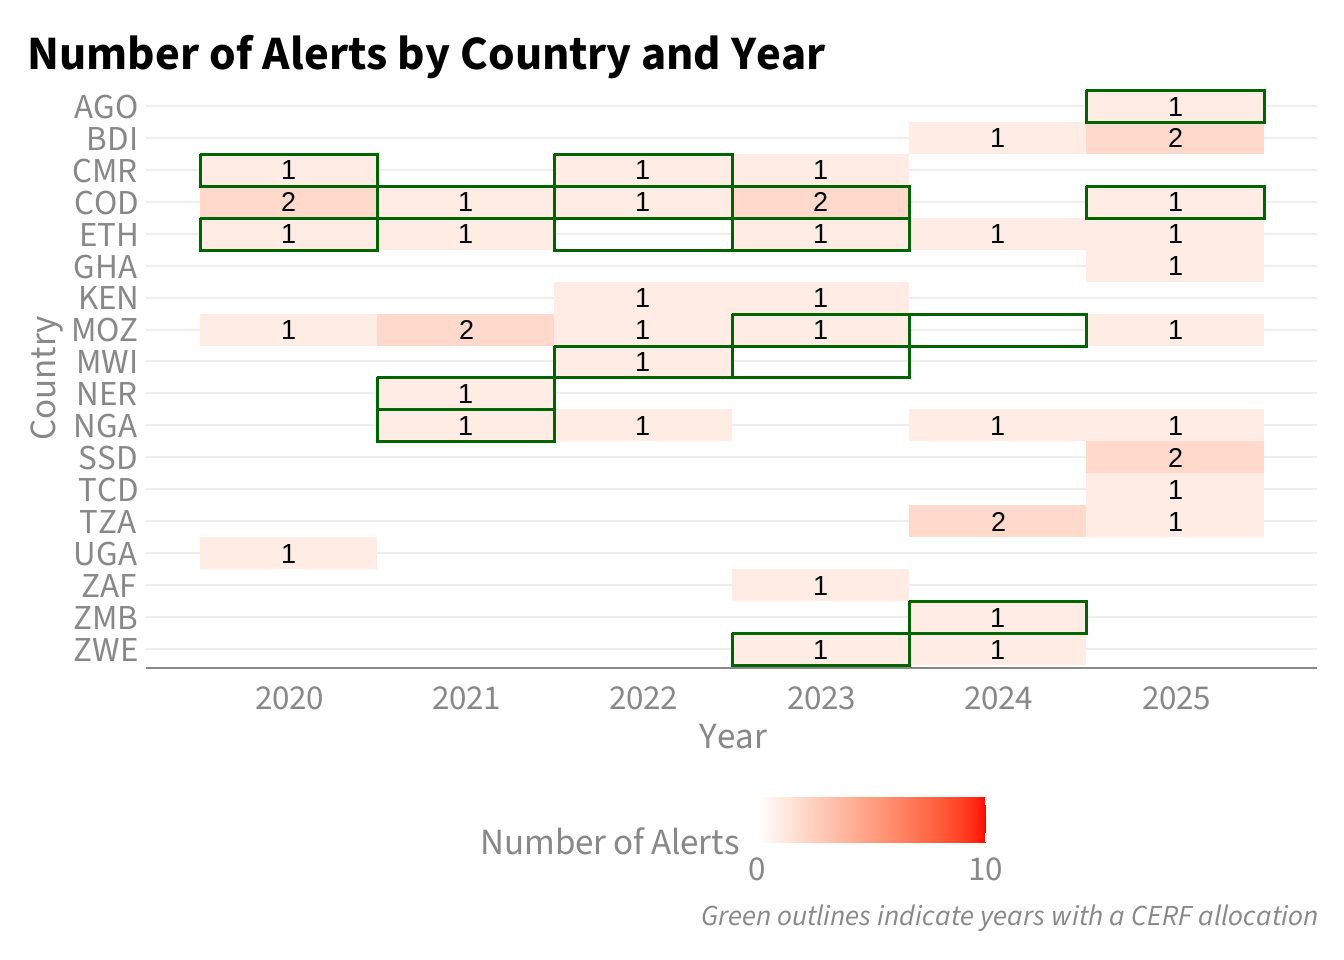
This approach removes zero weekly increases to focus only on meaningful changes in cases. An alert is triggered when the current weekly increase is the highest observed in the previous 12 months and exceeds the minimum case threshold. To avoid repeated signals during the same outbreak, a spacing rule is applied so that no new alert can be issued within the following three months.
Methodology 4: Three-Year Rolling Average Baseline
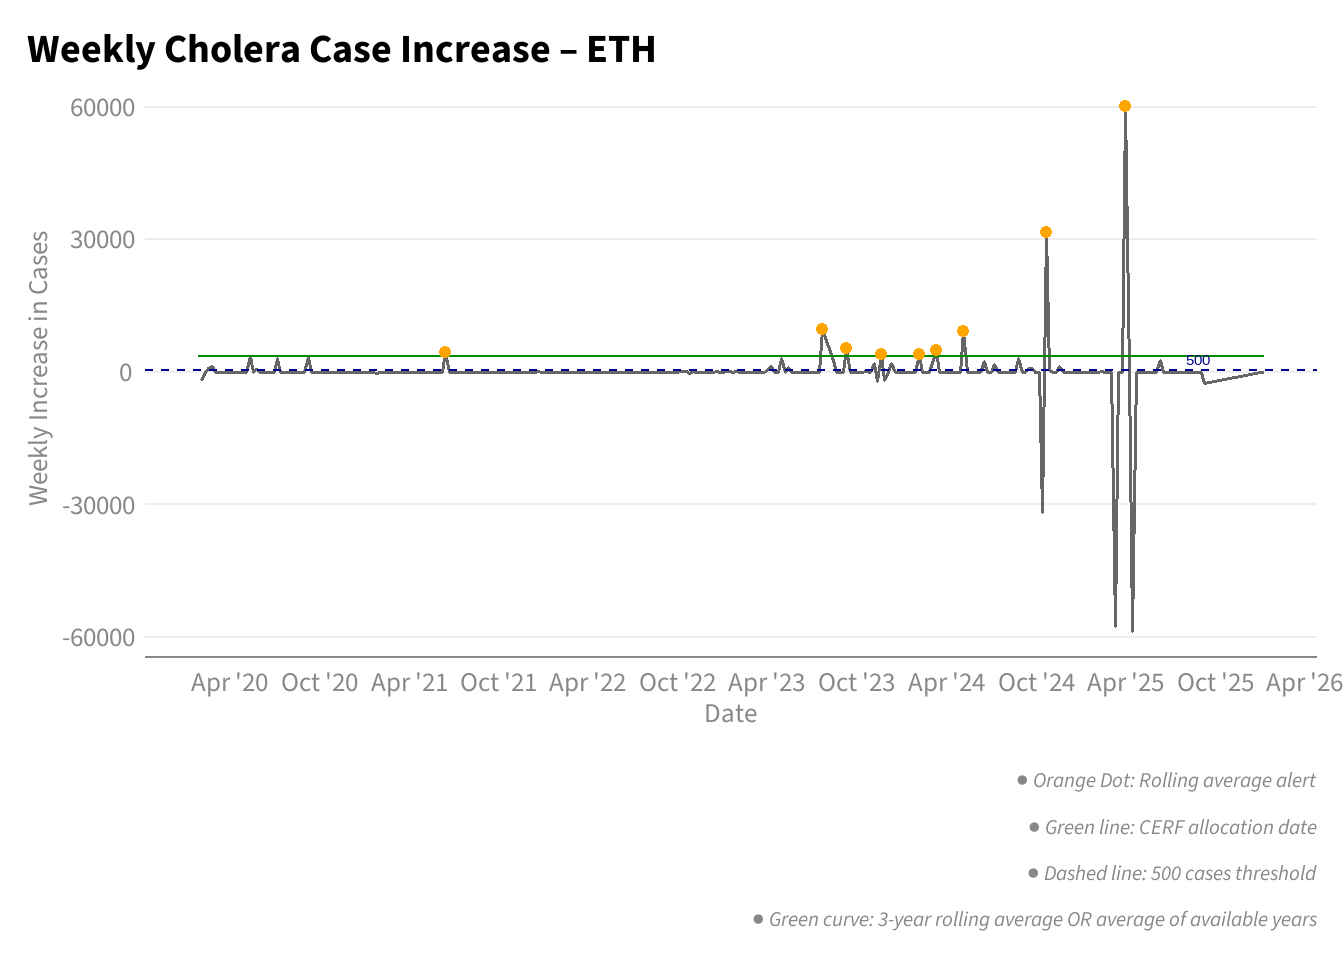
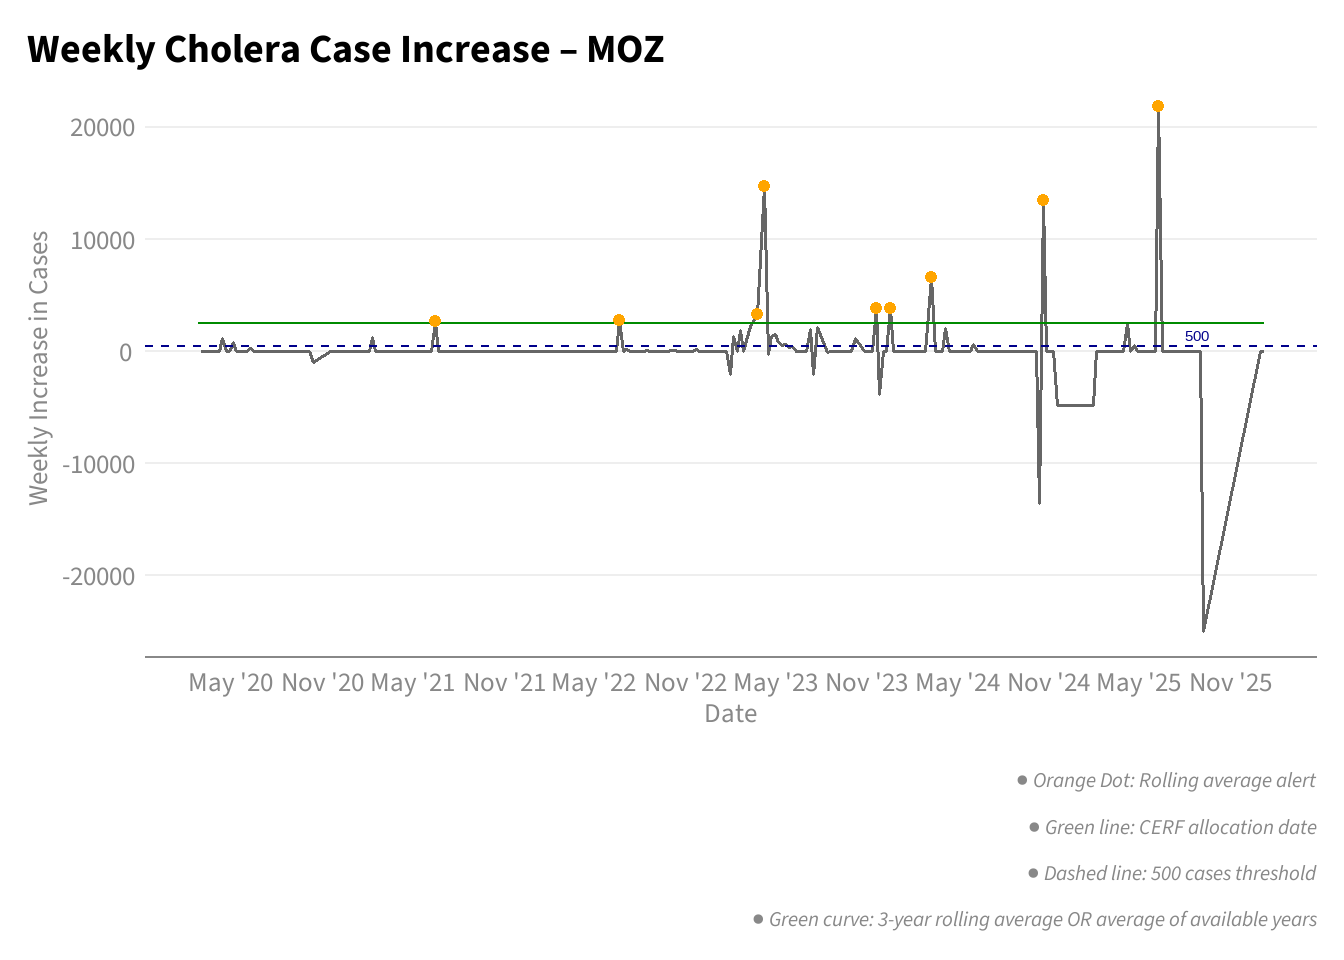
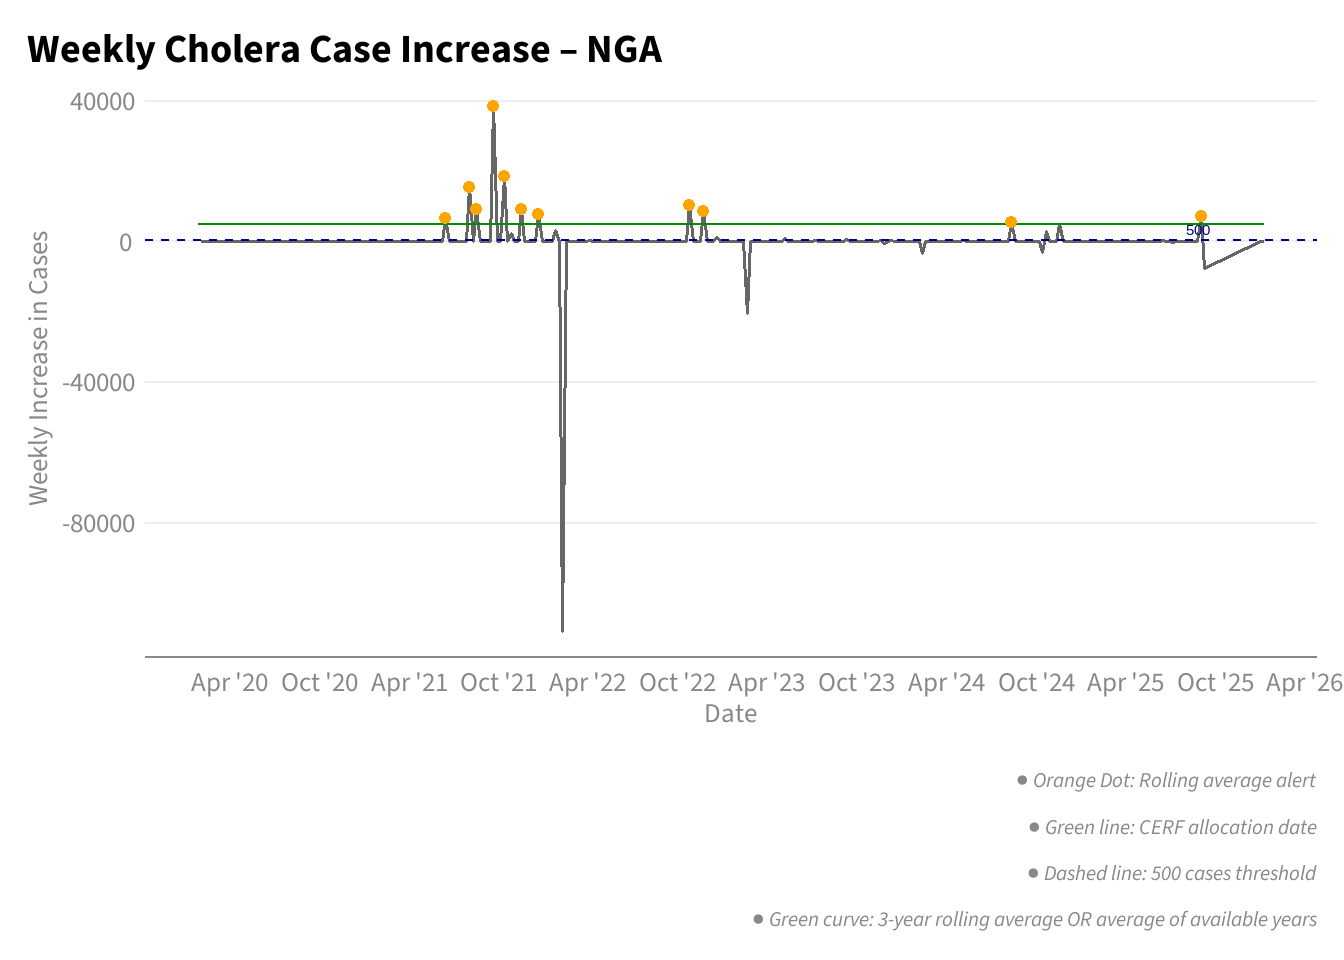
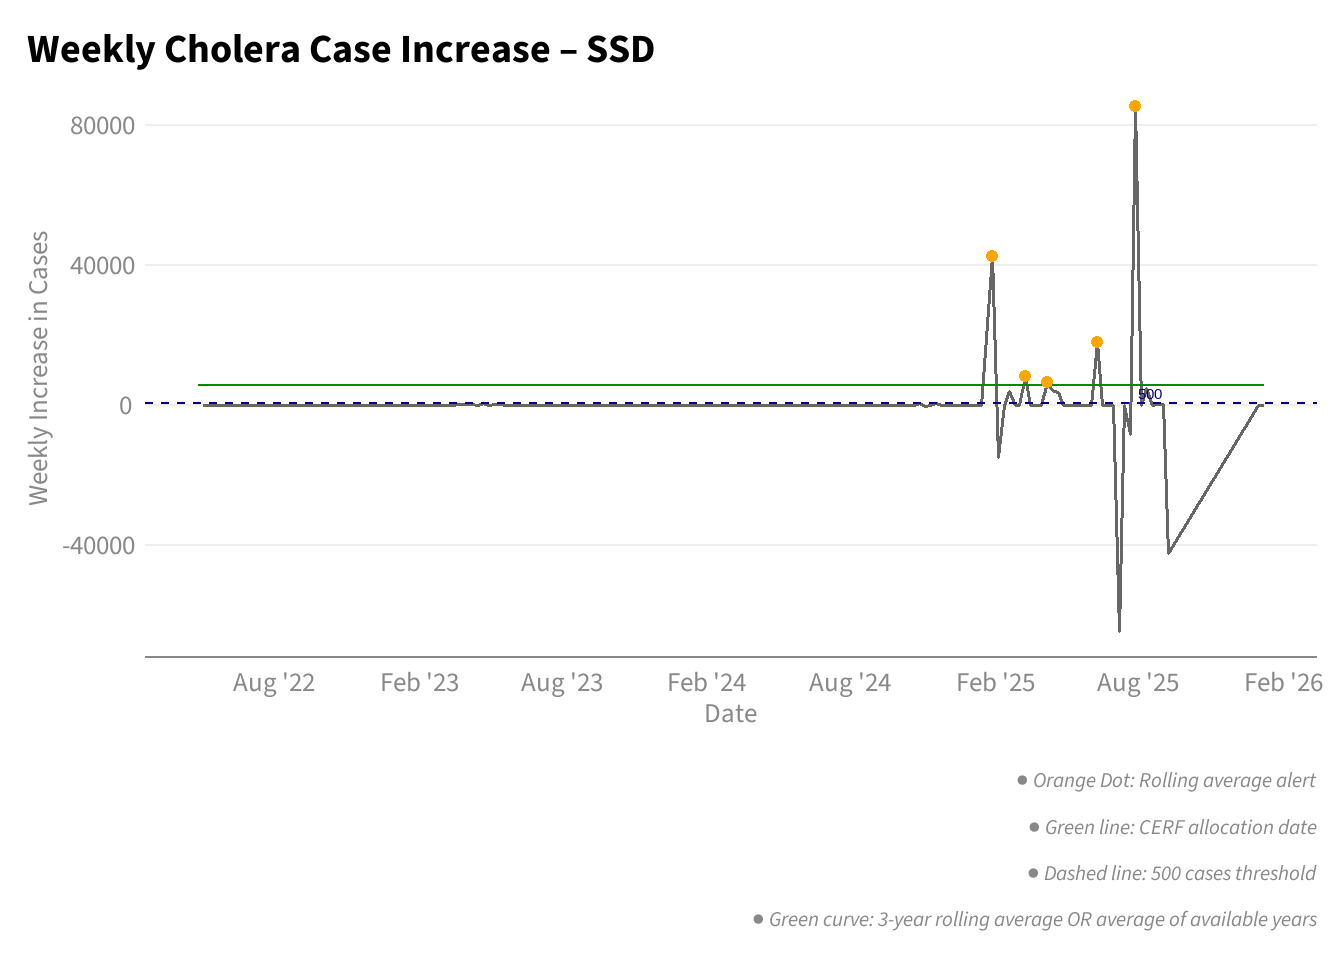
This approach compares current weekly increases to a rolling three-year historical average. An alert is triggered when the weekly increase exceeds this long-term baseline and meets a minimum threshold of 500 new cases.
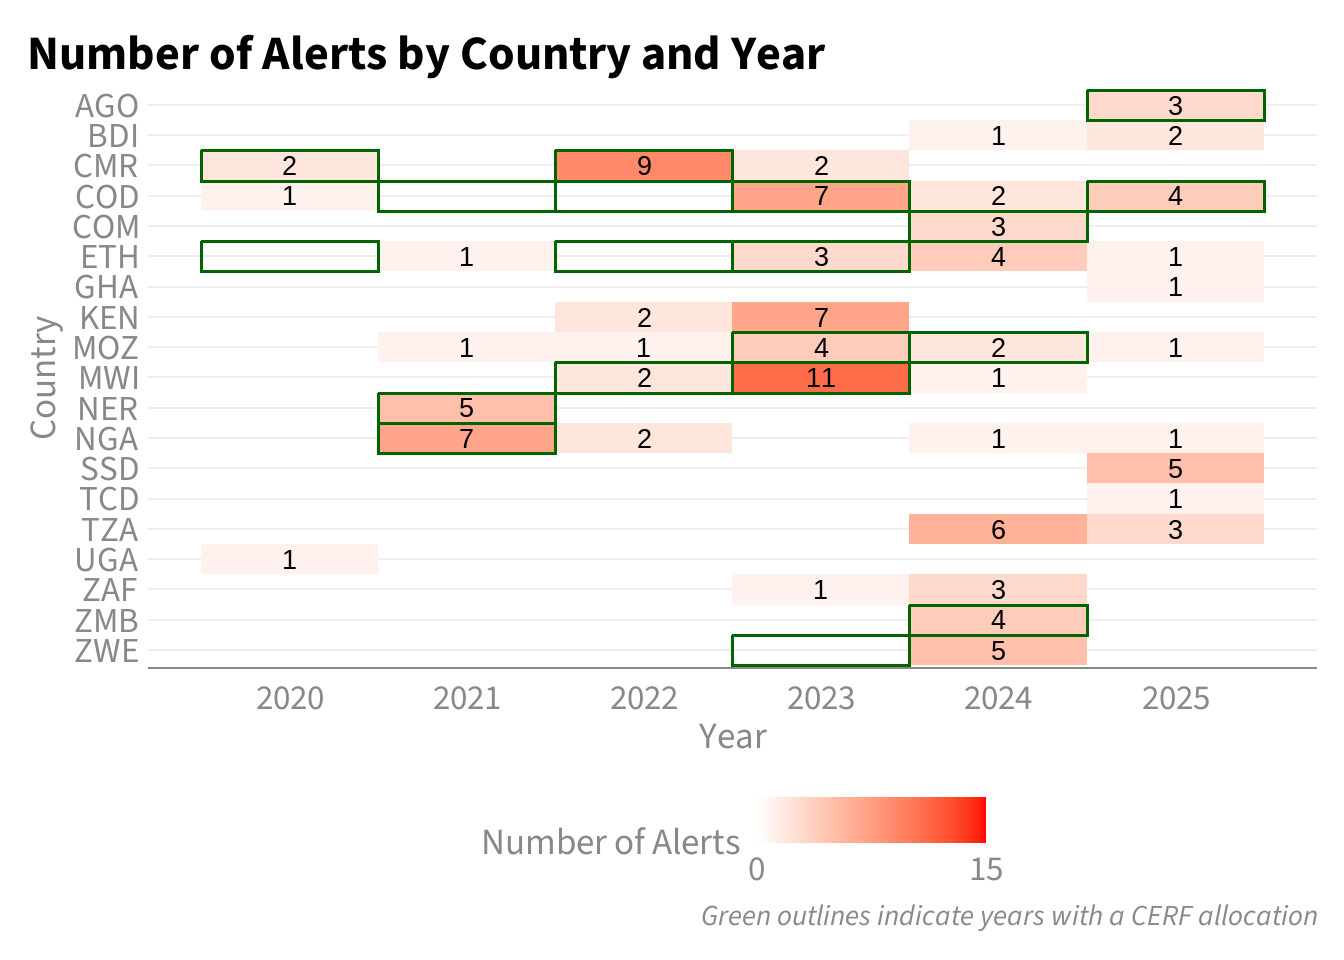
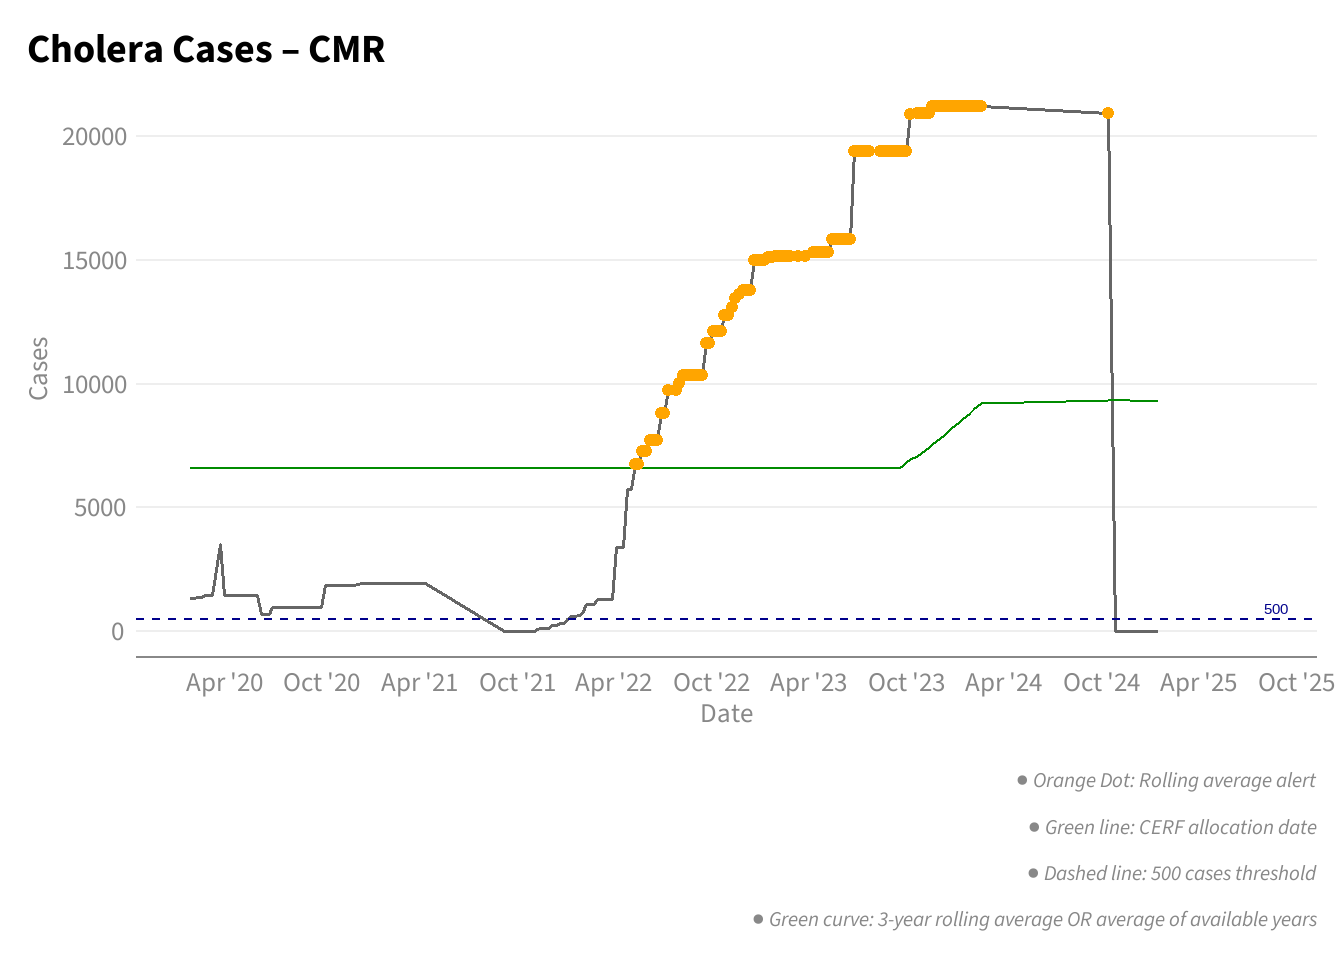
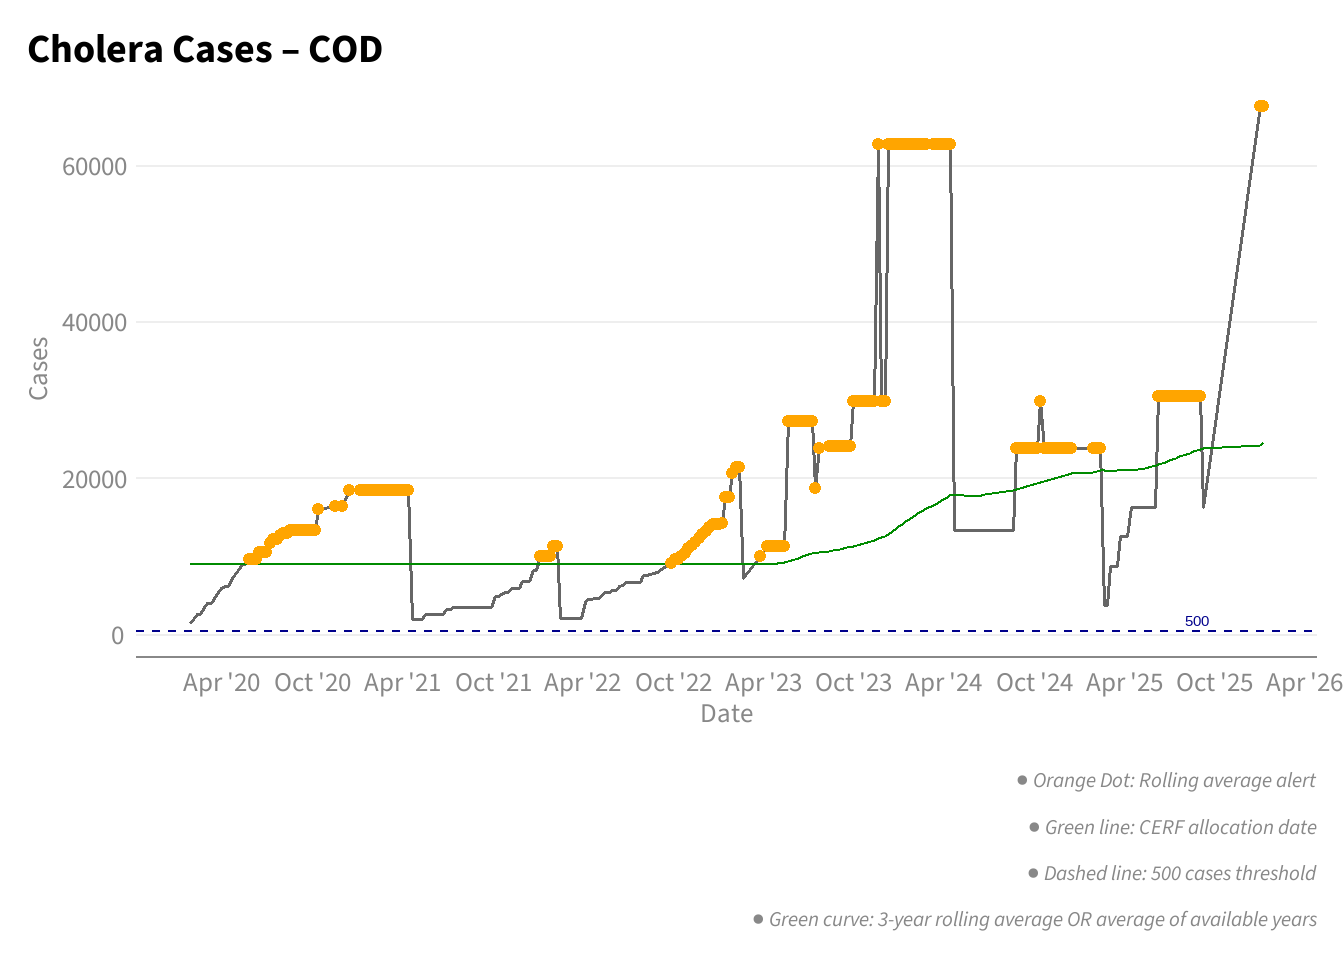
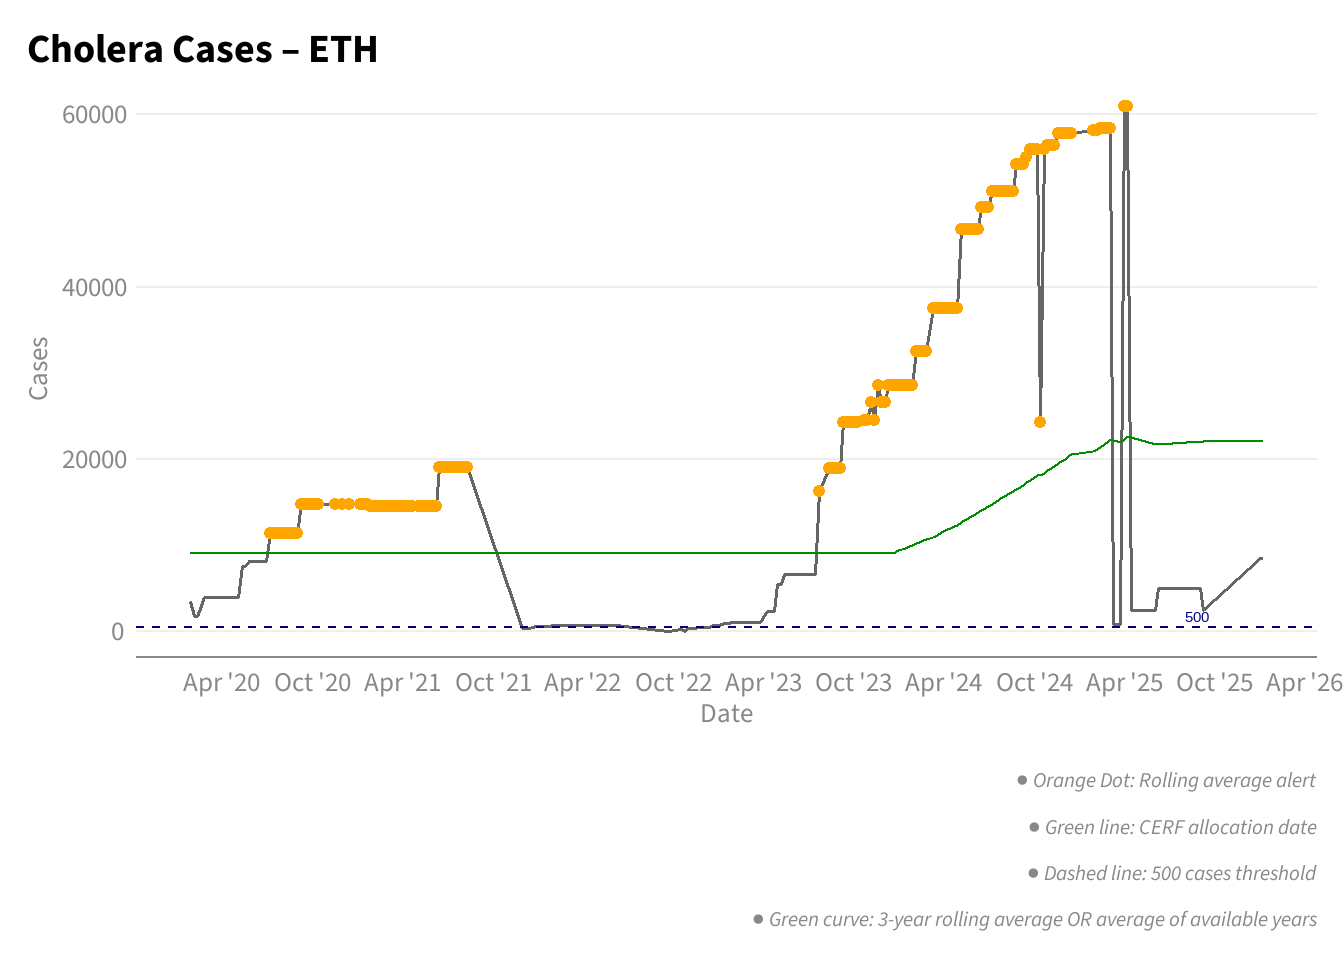
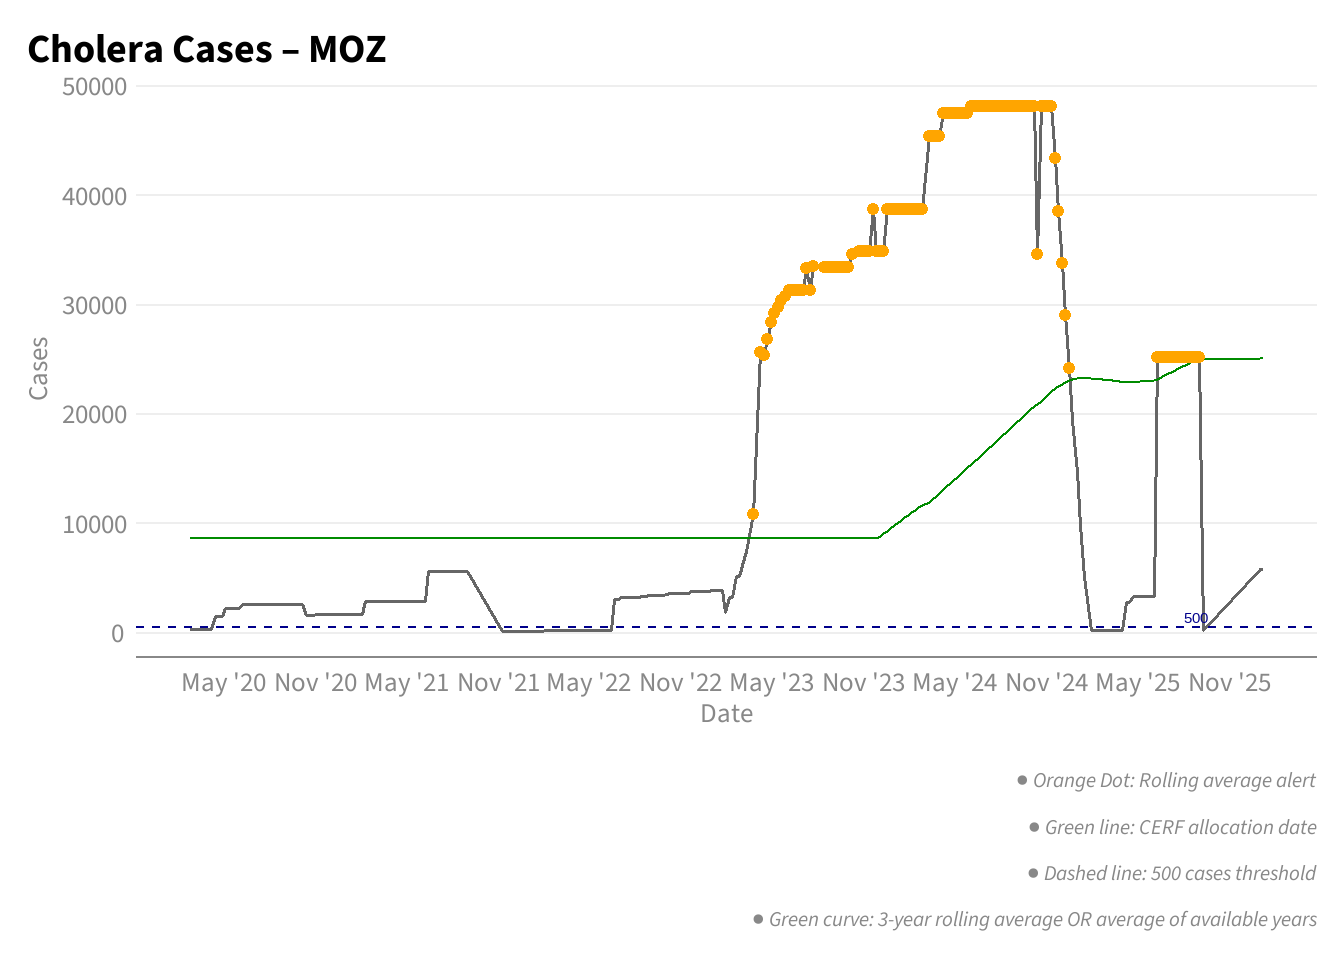
Timelines for Method 4.
Challenges of the Three-Year Rolling Average Approach
- Data Gaps and Inconsistencies
- Many countries do not have continuous weekly data spanning three years.
- Missing weeks reduce the reliability of the rolling baseline.
- Short Time Series
- For countries with only 1–2 years of data, the rolling baseline effectively becomes a simple average, limiting its usefulness.
- Sensitivity to Small Spikes
- Modest increases can exceed the rolling mean and trigger alerts, even when there is no substantial outbreak.
- Repeated Alerts During the Same Event
- Sustained high transmission may generate multiple alerts for a single outbreak episode.
Timeline using the weekly increase in cases
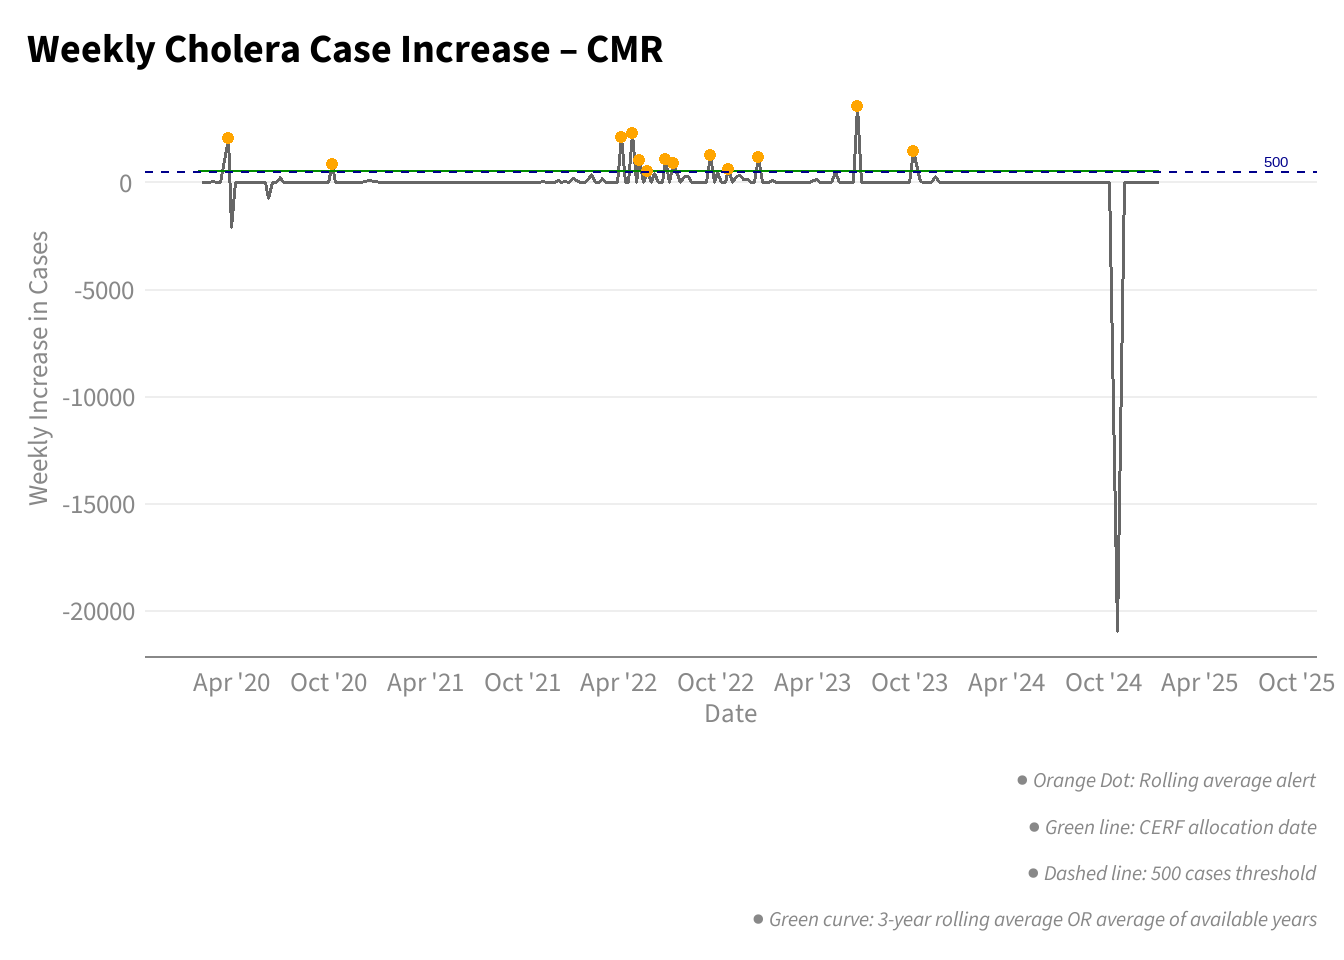
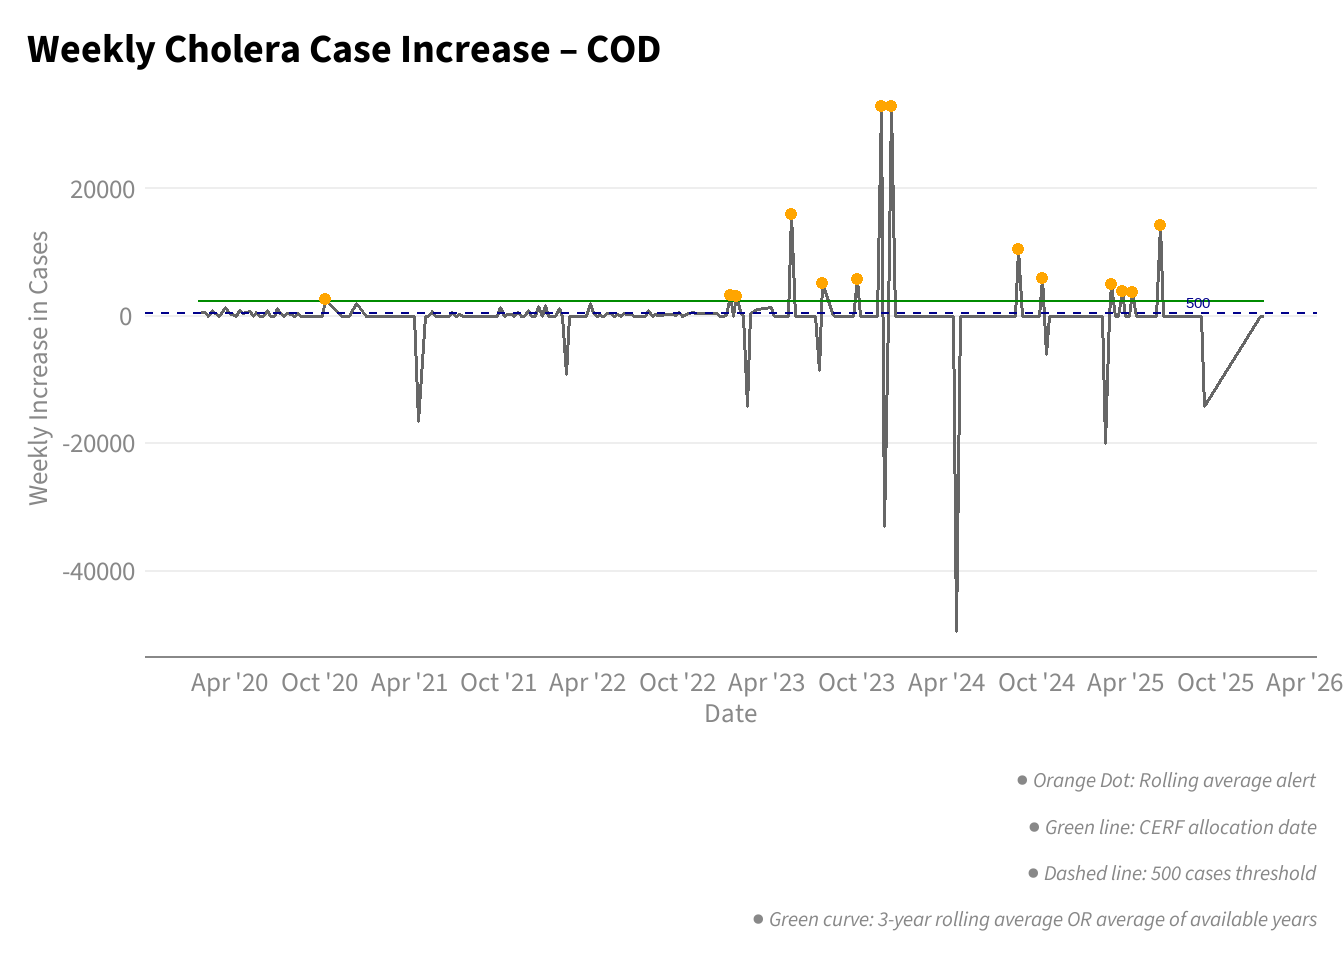
This timeline presents the weekly increase in reported cholera cases for each selected country. The grey line represents the observed weekly change in cases, while the green curve shows the three-year rolling average baseline used for comparison. Alerts are indicated by orange markers when weekly increases exceed both the rolling baseline and the minimum threshold of 500 cases. Vertical green lines denote CERF allocation dates.
Timeline using the cumulative cases
This timeline presents cumulative reported cholera cases over time for each selected country. The grey line represents the cumulative case trajectory, while the green curve shows the three-year rolling average baseline (or the average of available years where three years of data are not available). Orange markers indicate weeks where cumulative cases exceed both the rolling baseline and the minimum threshold of 500 cases. Vertical green lines denote CERF allocation dates.
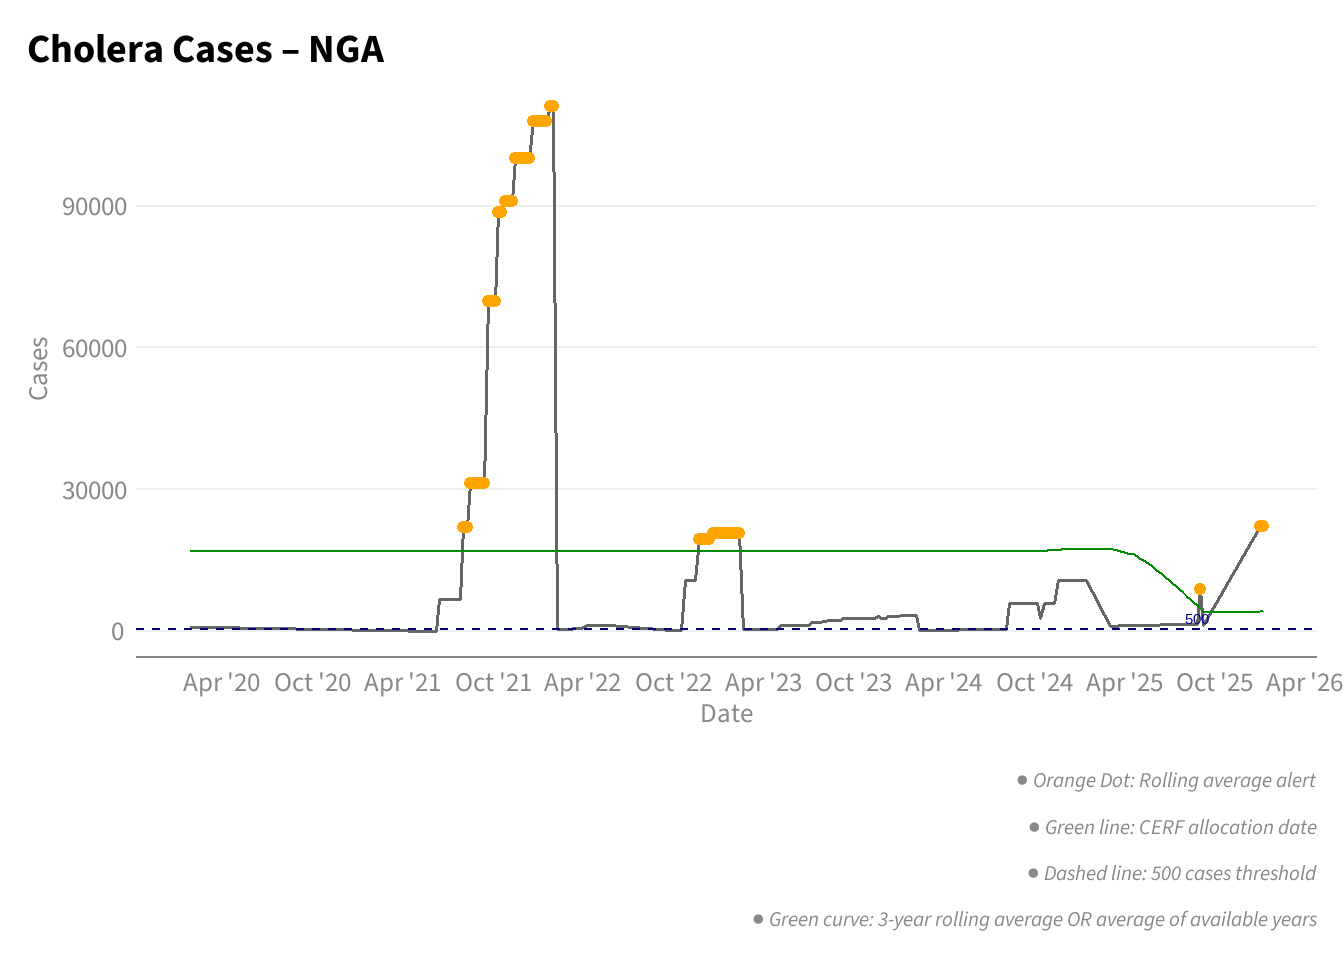
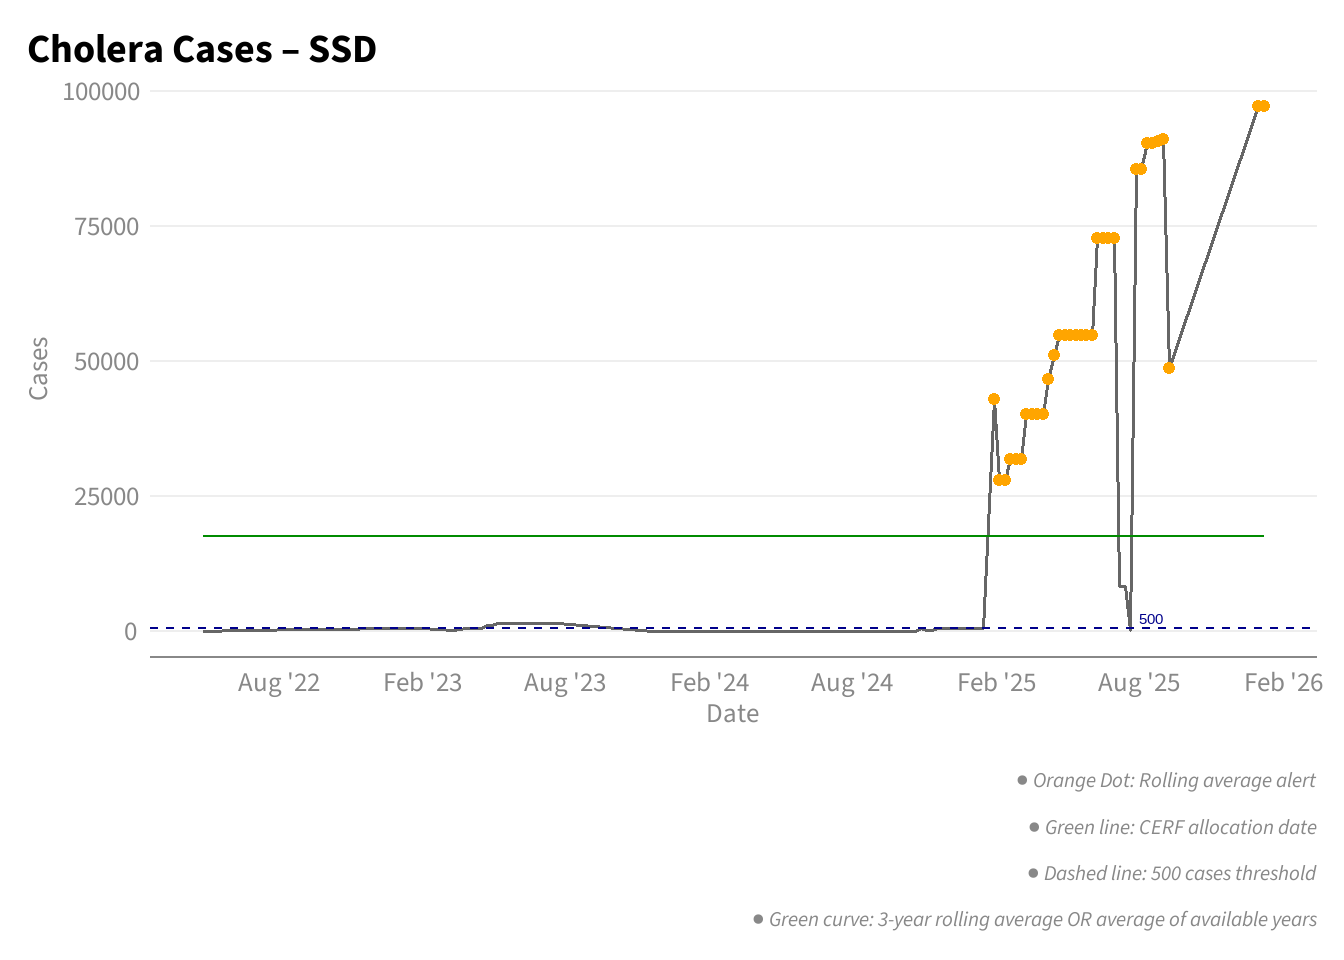
Time Series of Cases by Country
A time series of cases by country showing the alert levels
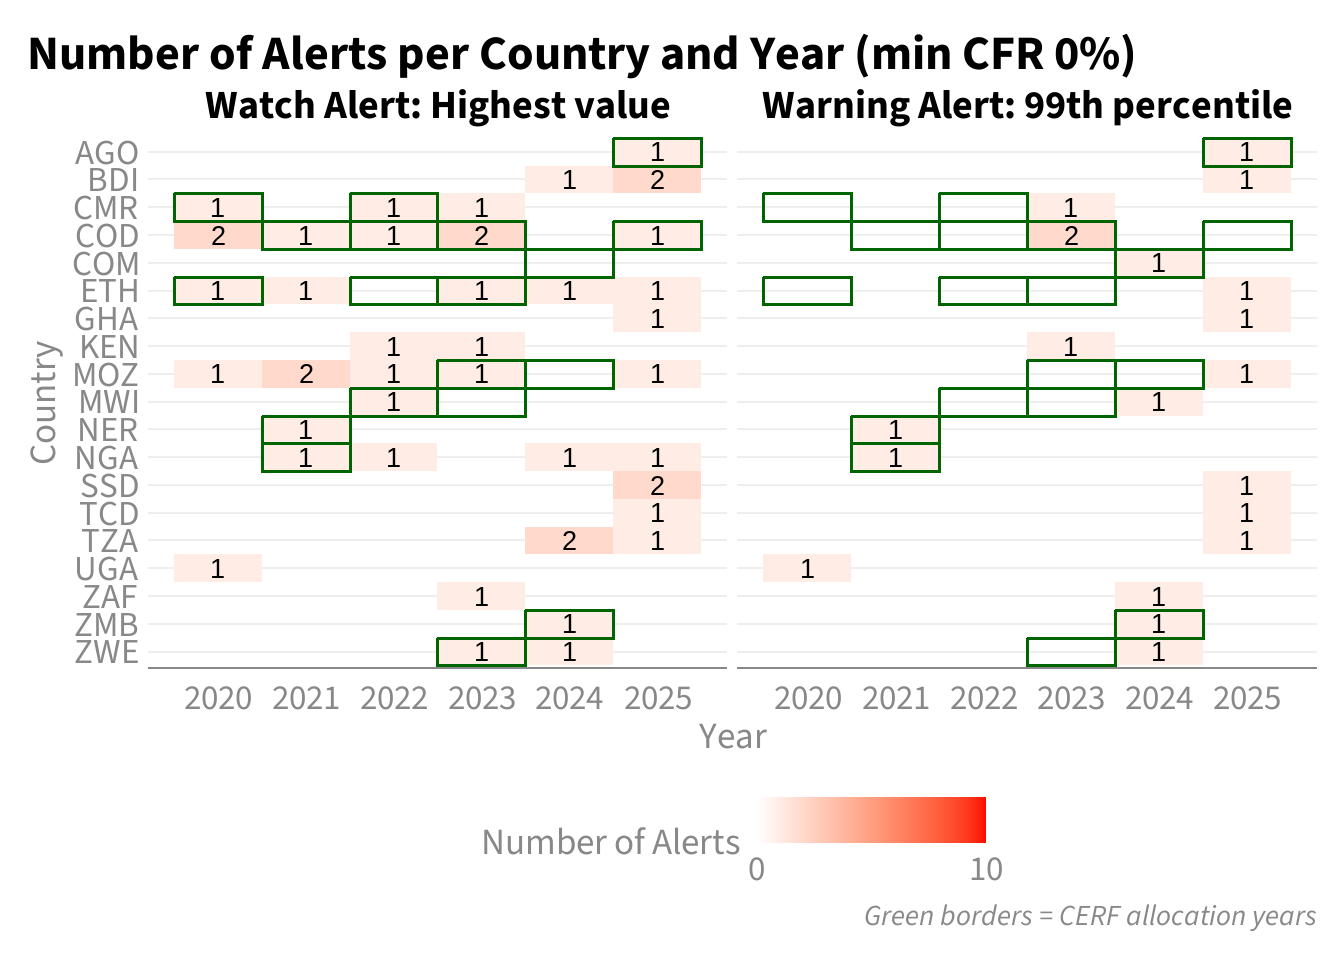
Final proposal
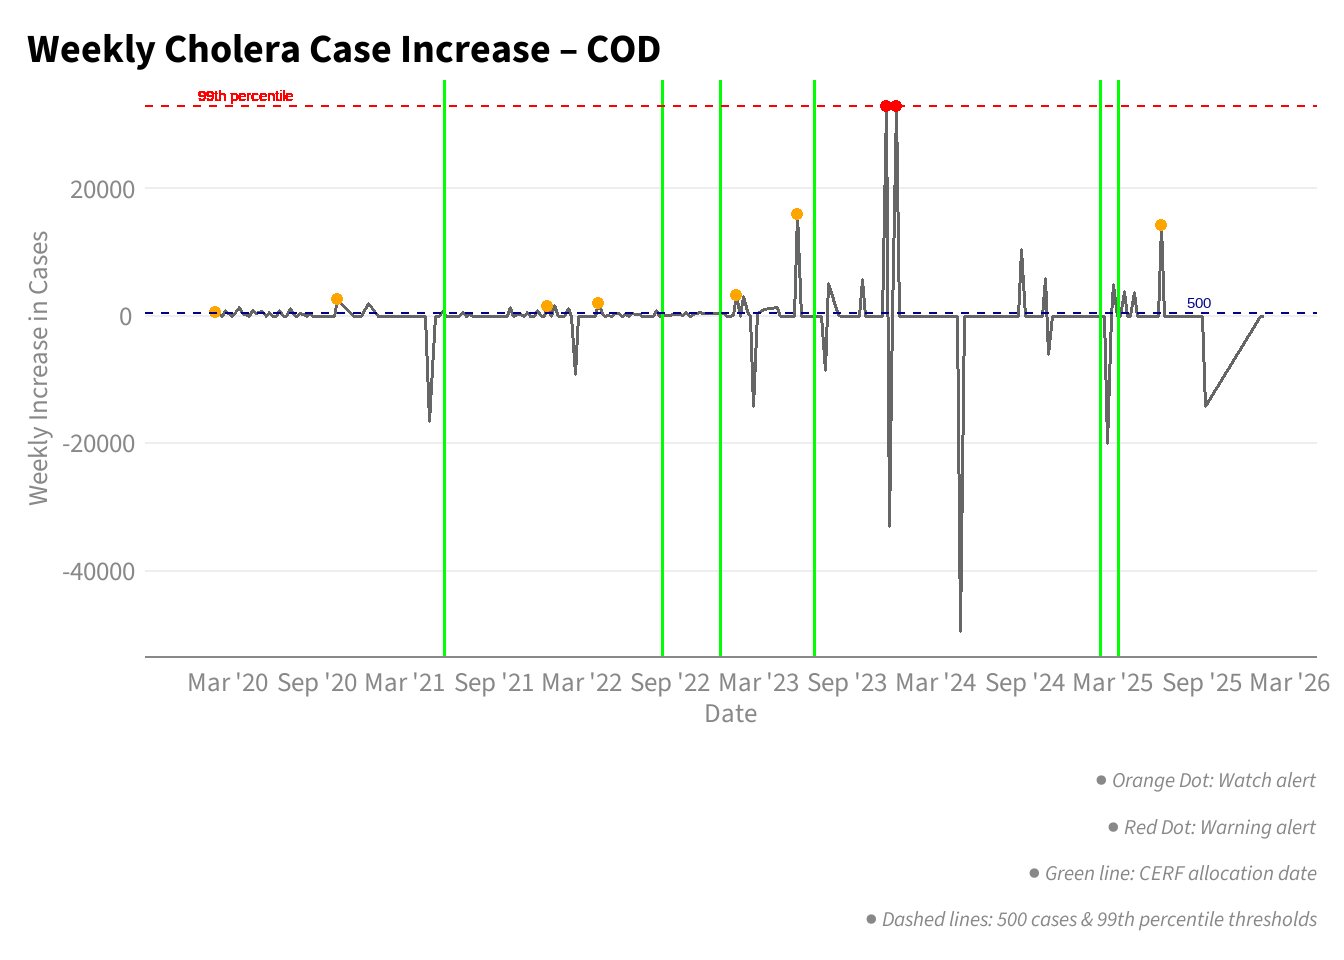
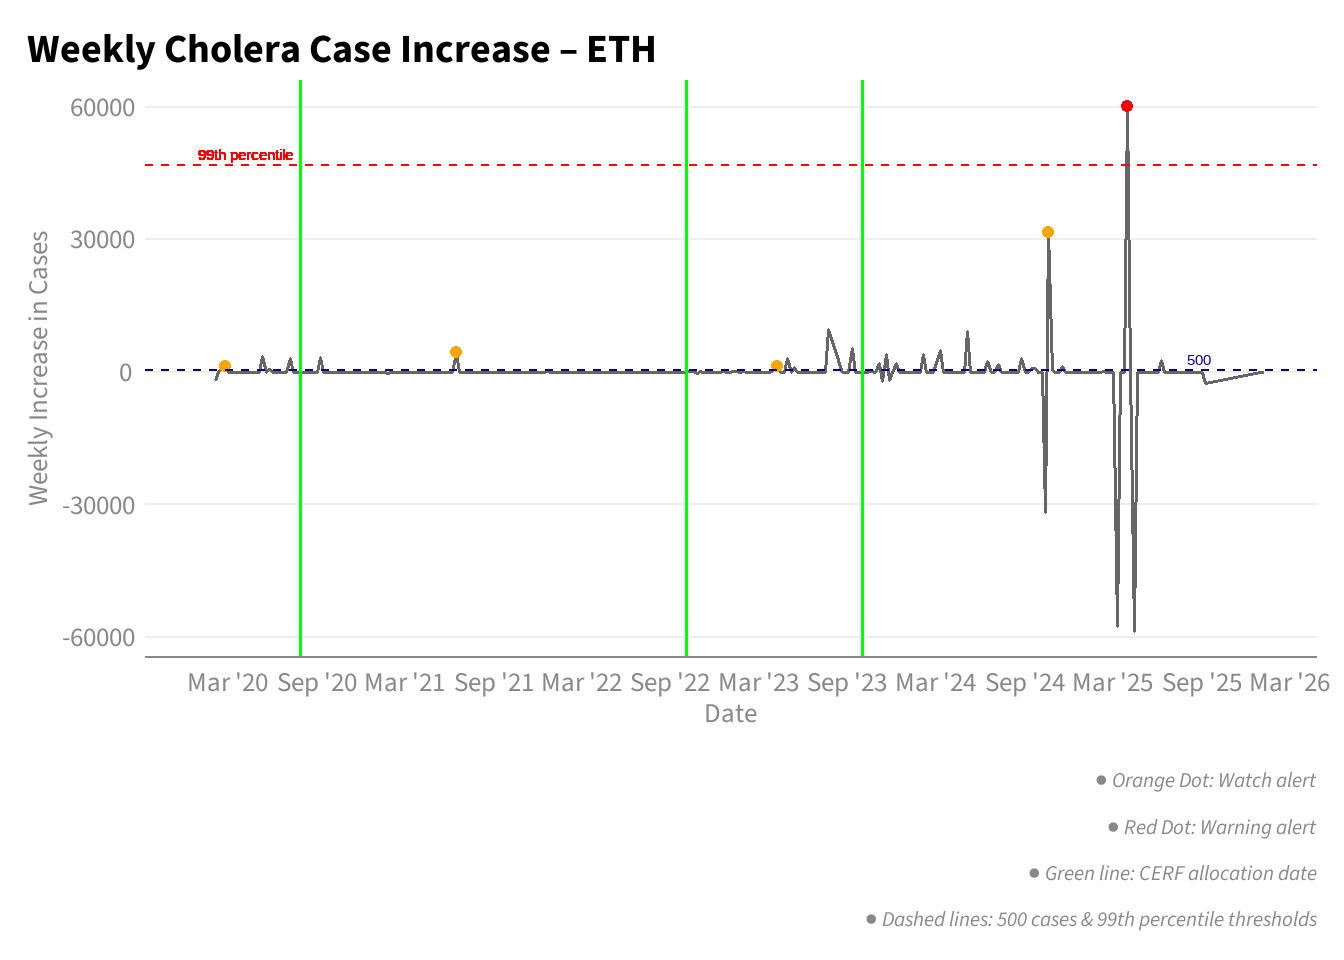
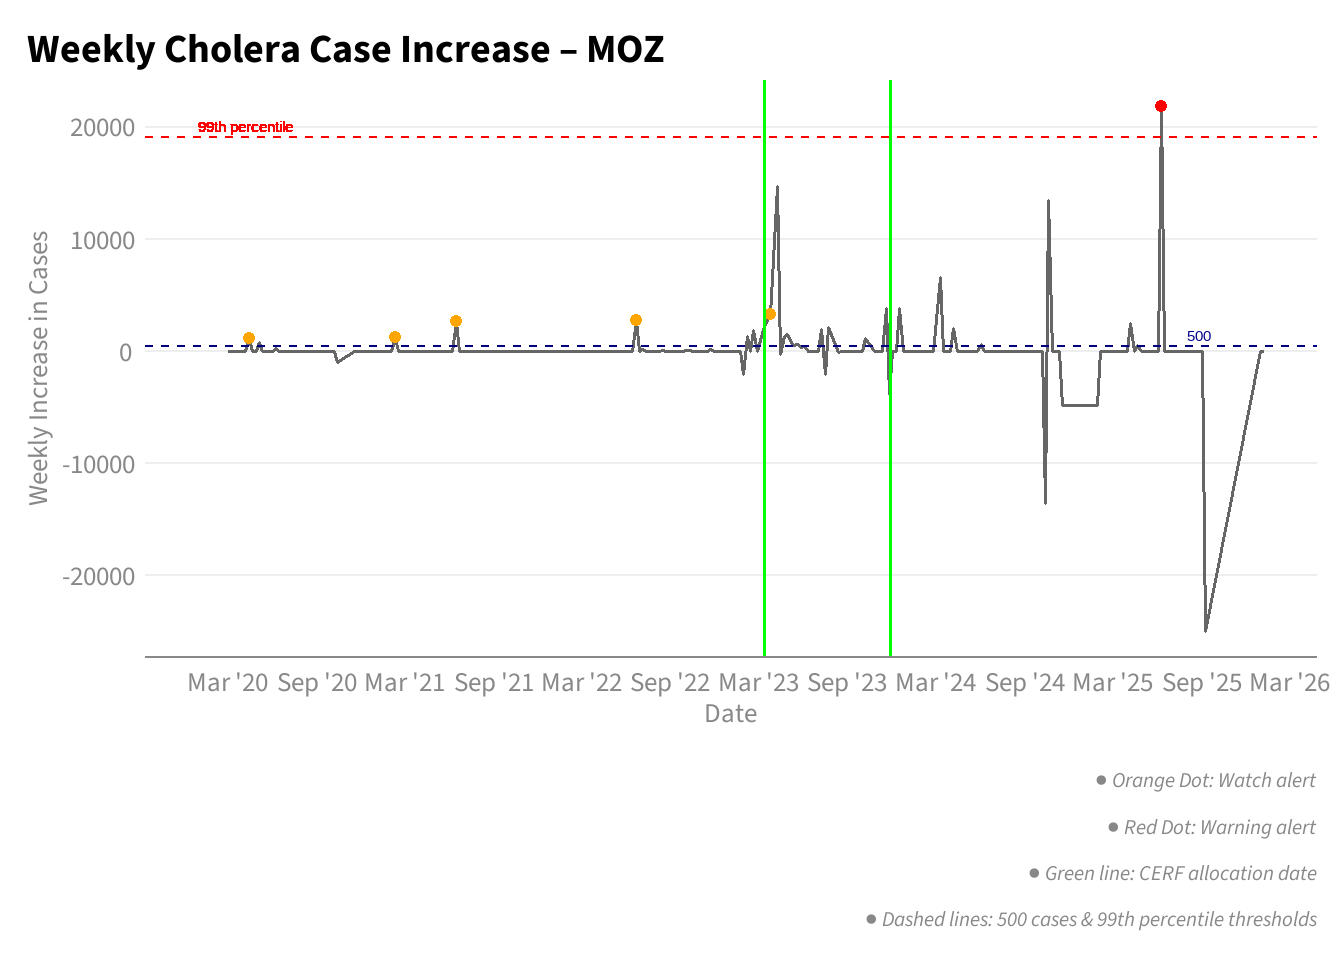
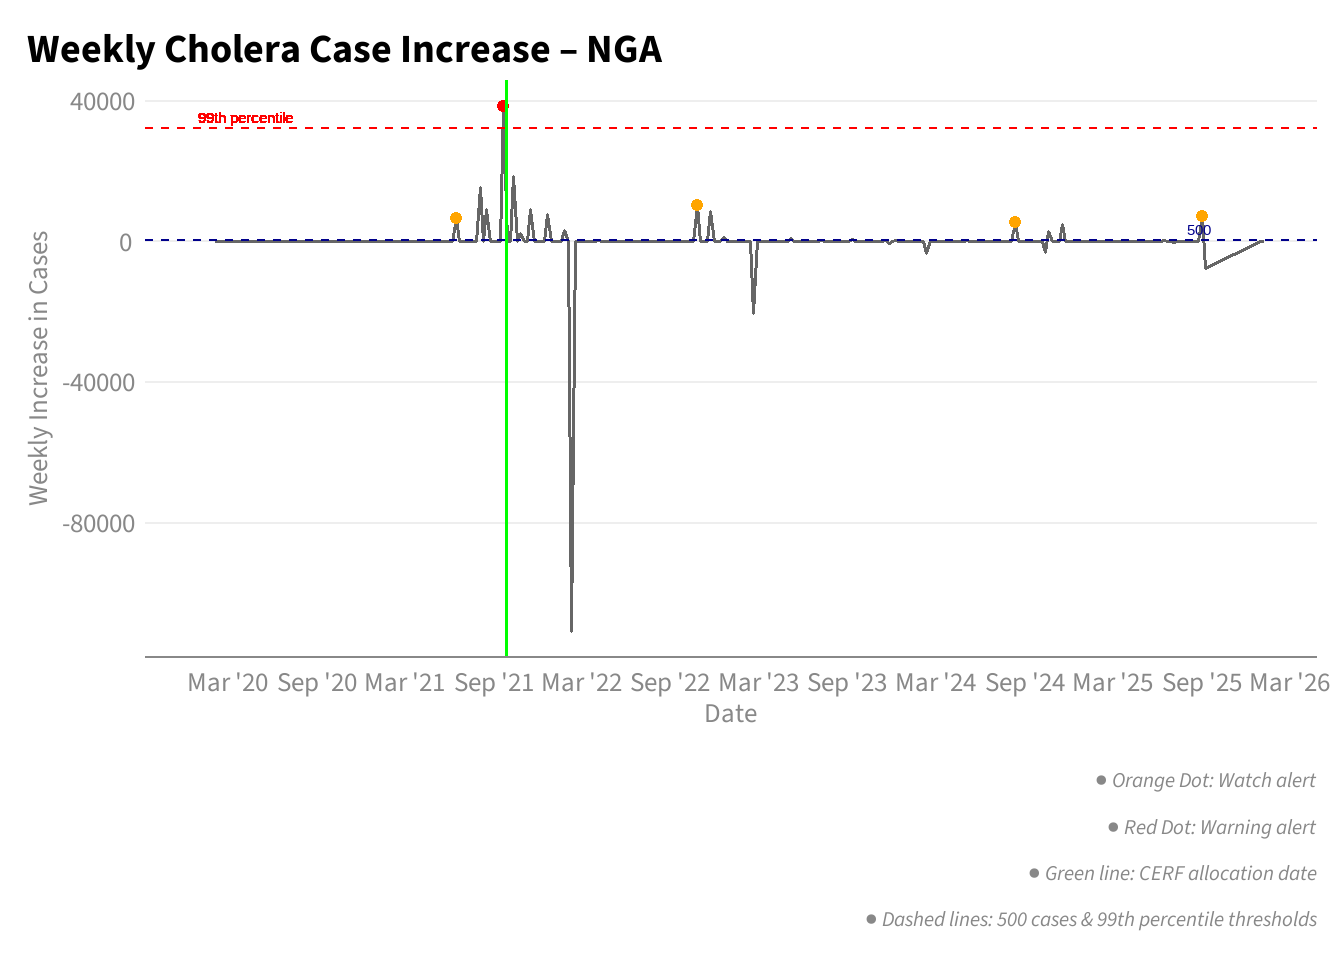
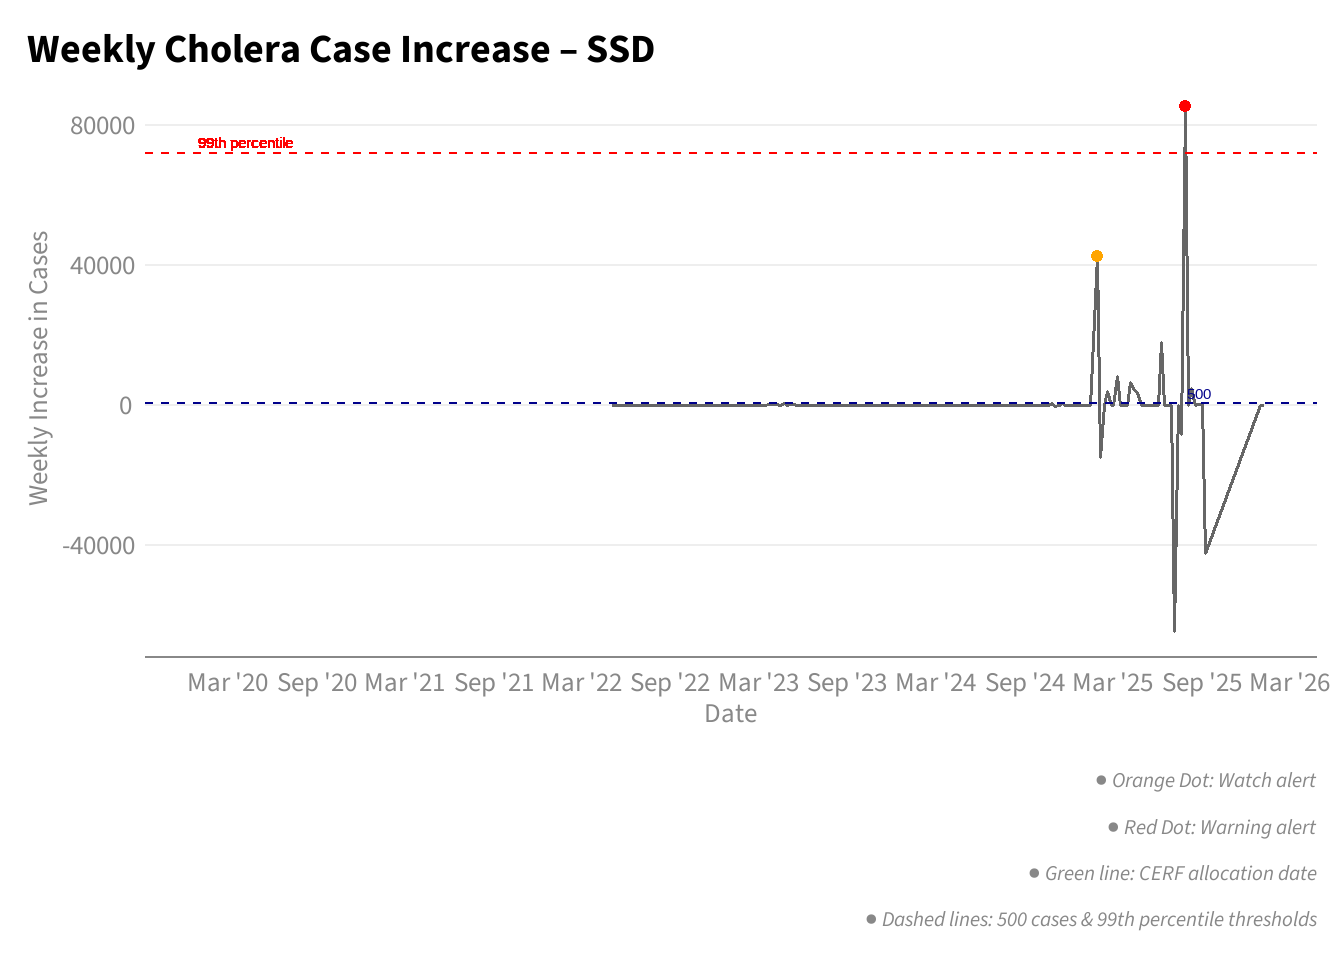
Based on the comparative analysis of the different trigger approaches, the following two-tier alert system is proposed:
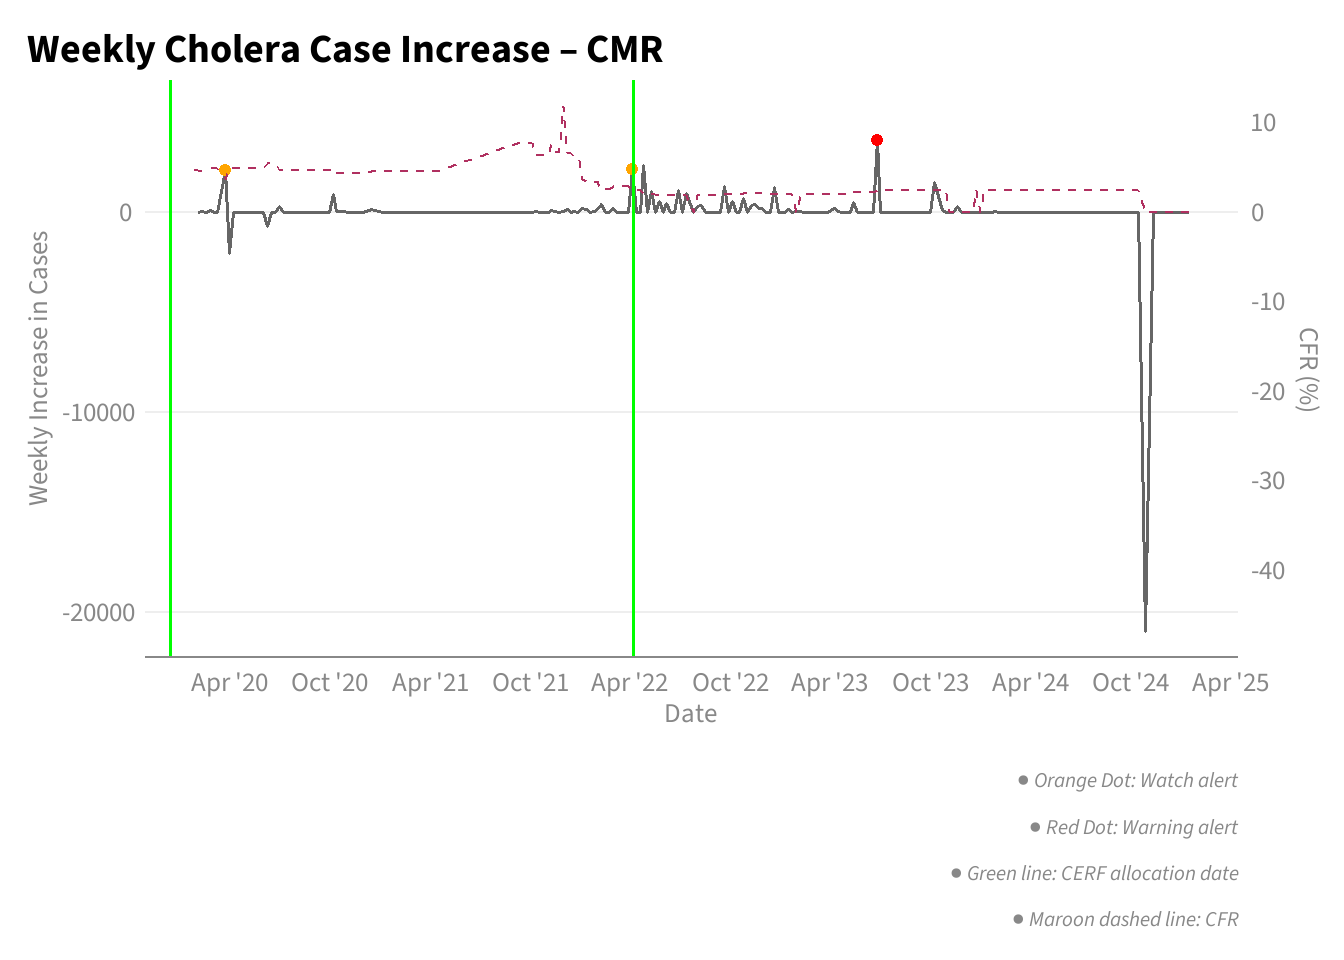
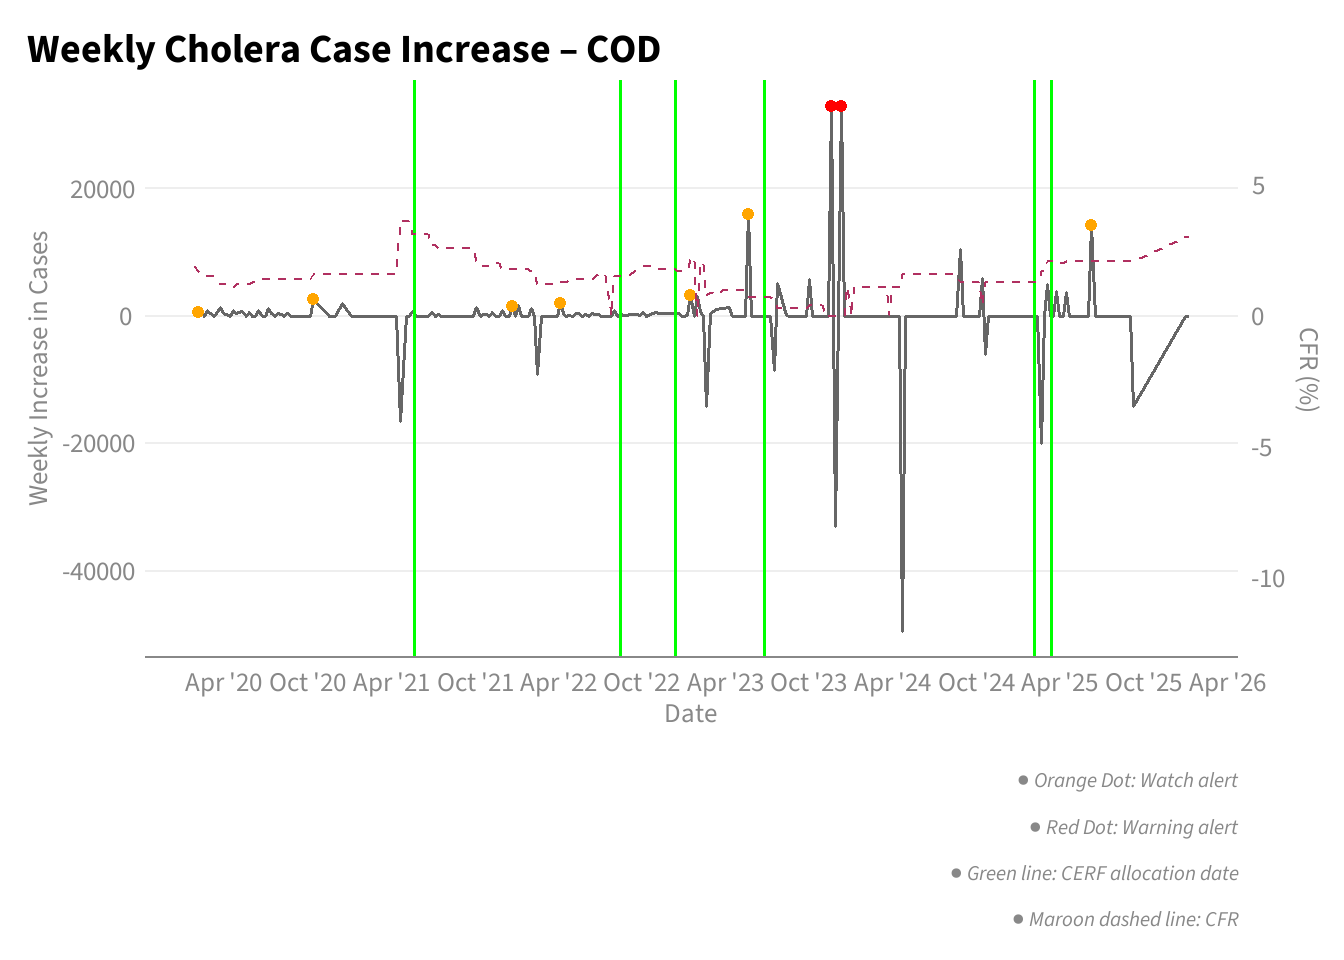
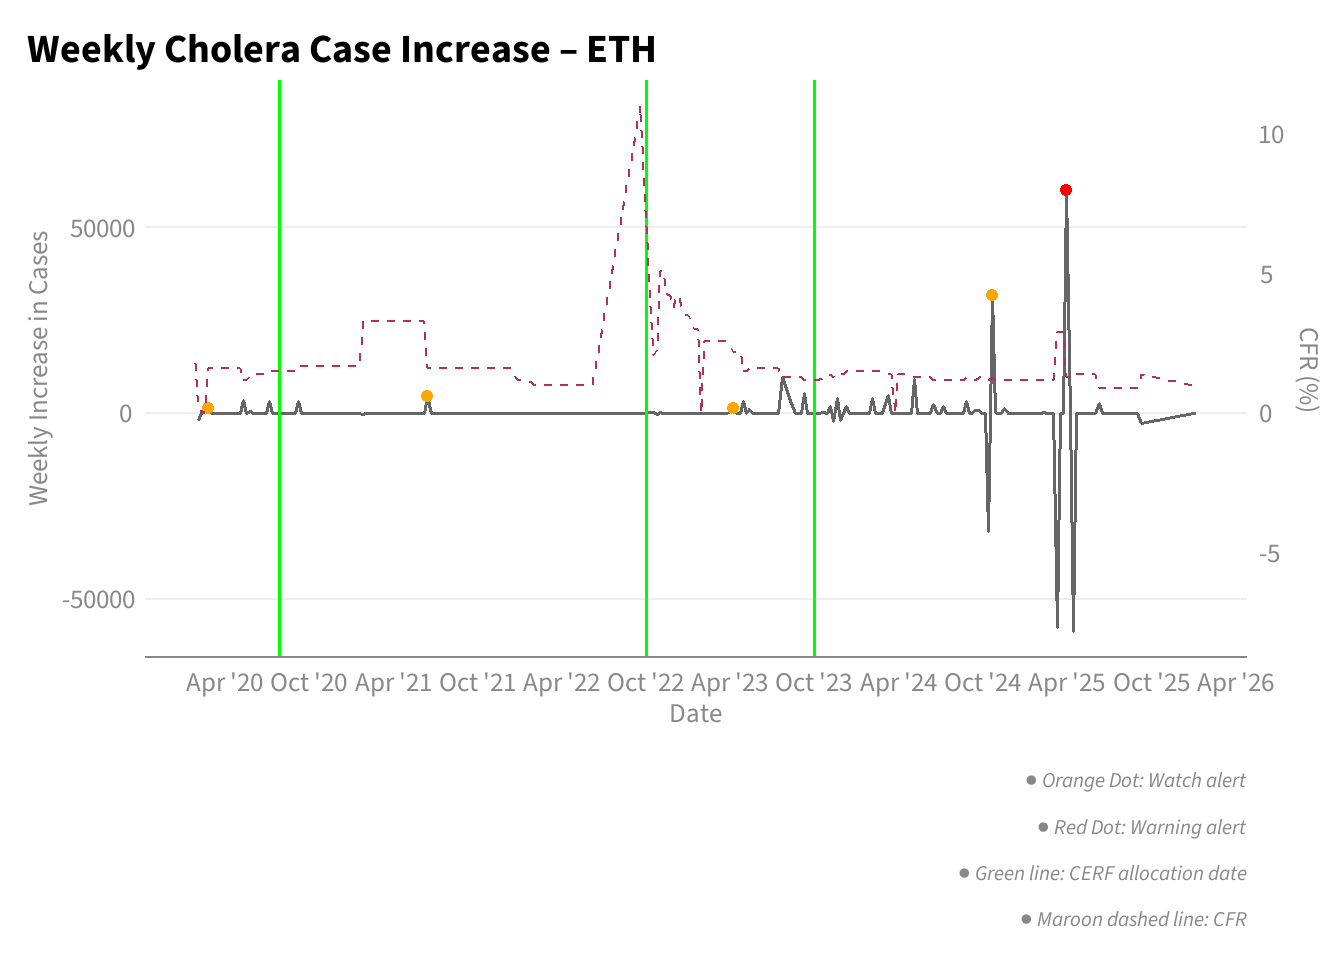
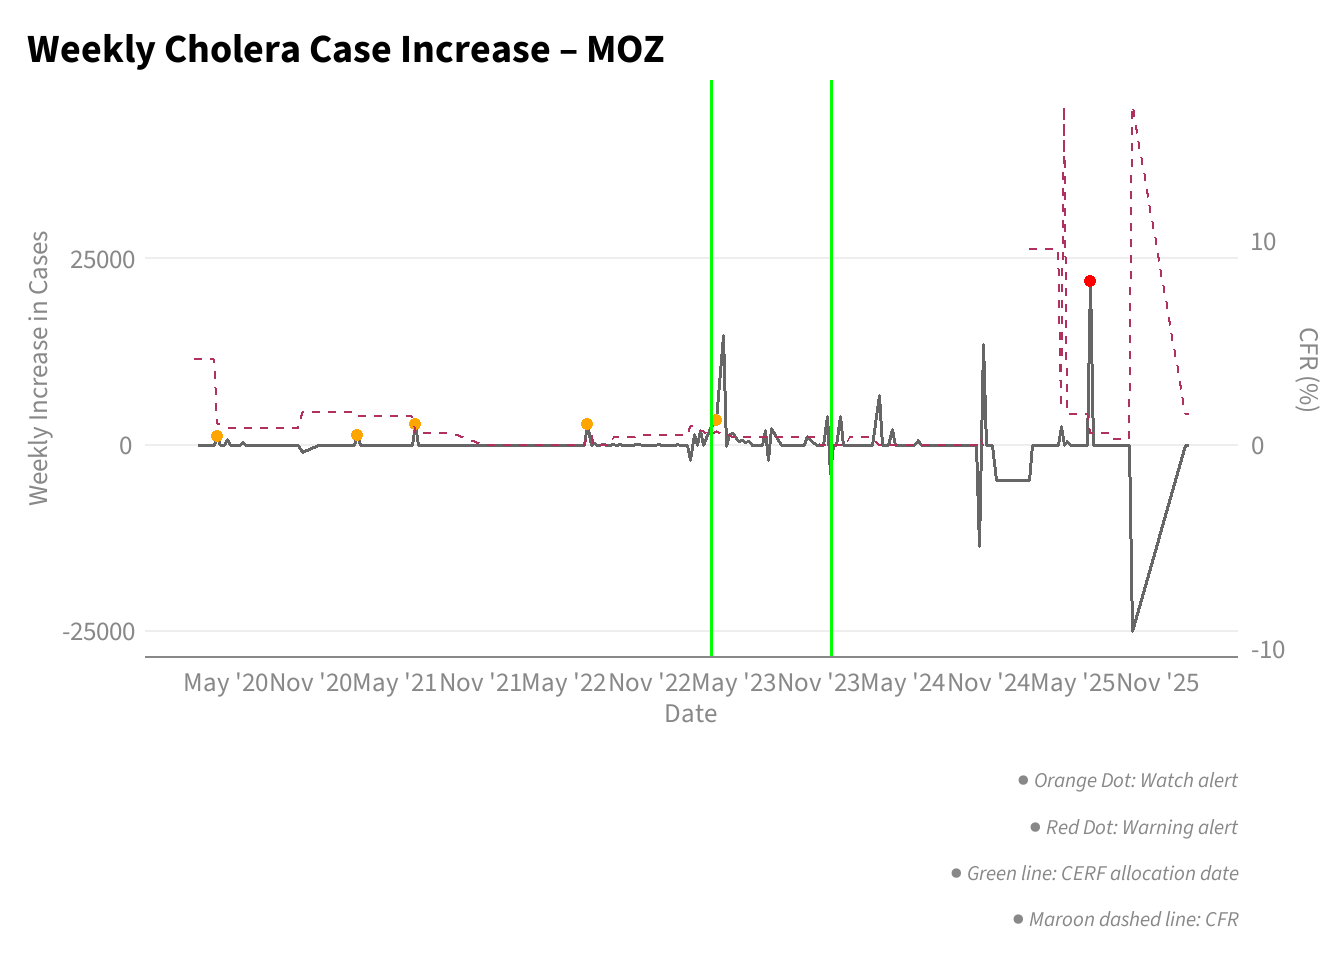
Watch Alert: Triggered when the current weekly increase is the highest observed in the previous 12 months. This signal is designed to detect emerging peaks and early acceleration in transmission.
Warning Alert: Triggered when the weekly increase exceeds the historical 99th percentile. This signal identifies extreme surges that are statistically rare and likely to represent significant outbreak escalation.
Together, these thresholds balance early detection (Watch) with identification of severe, high-impact events (Warning), while limiting unnecessary repeat alerts.
Country-Level Alert Timelines
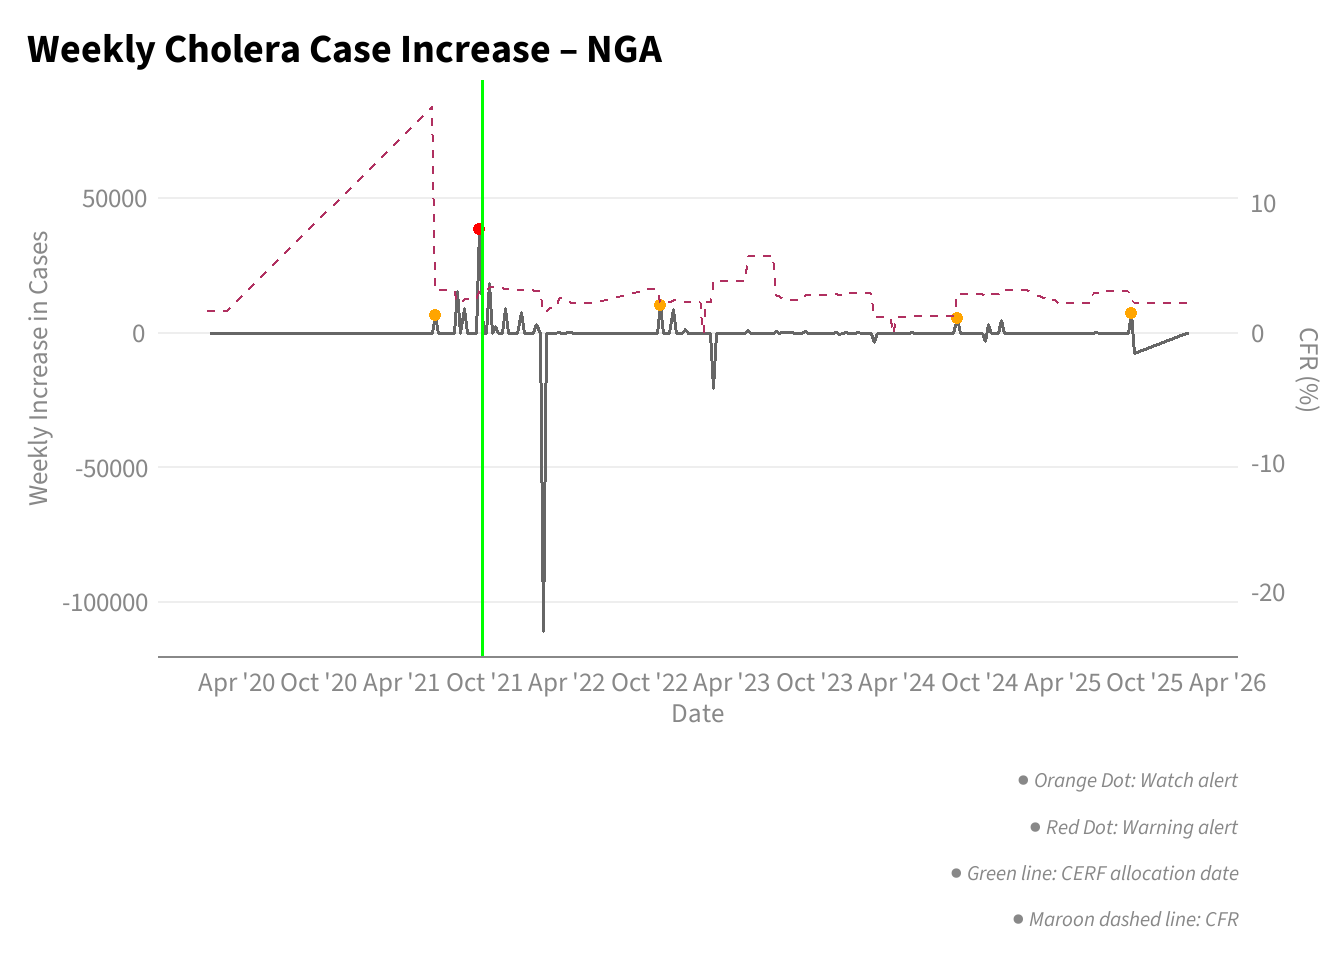
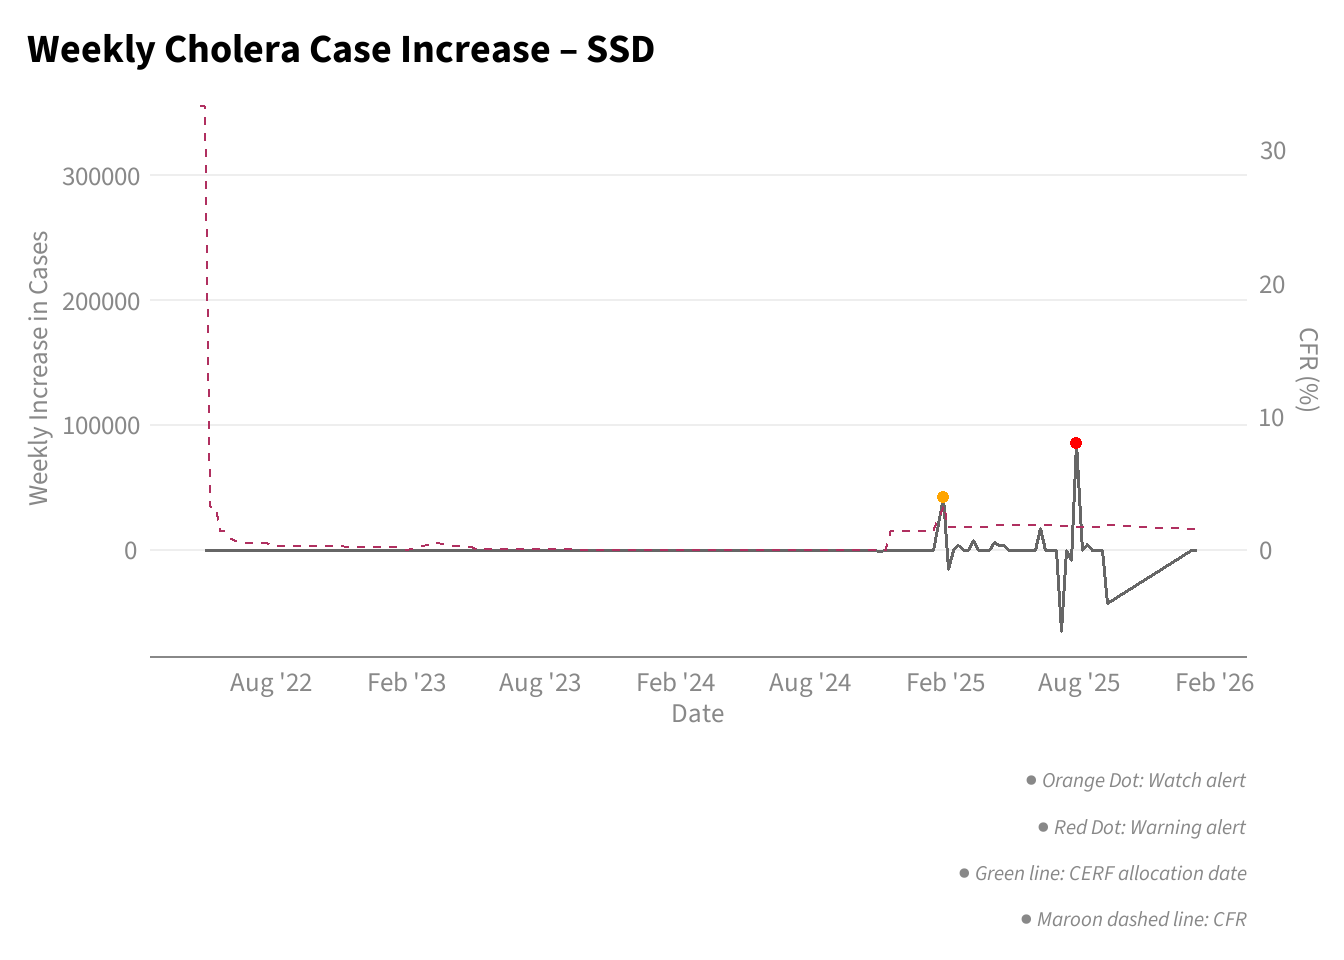
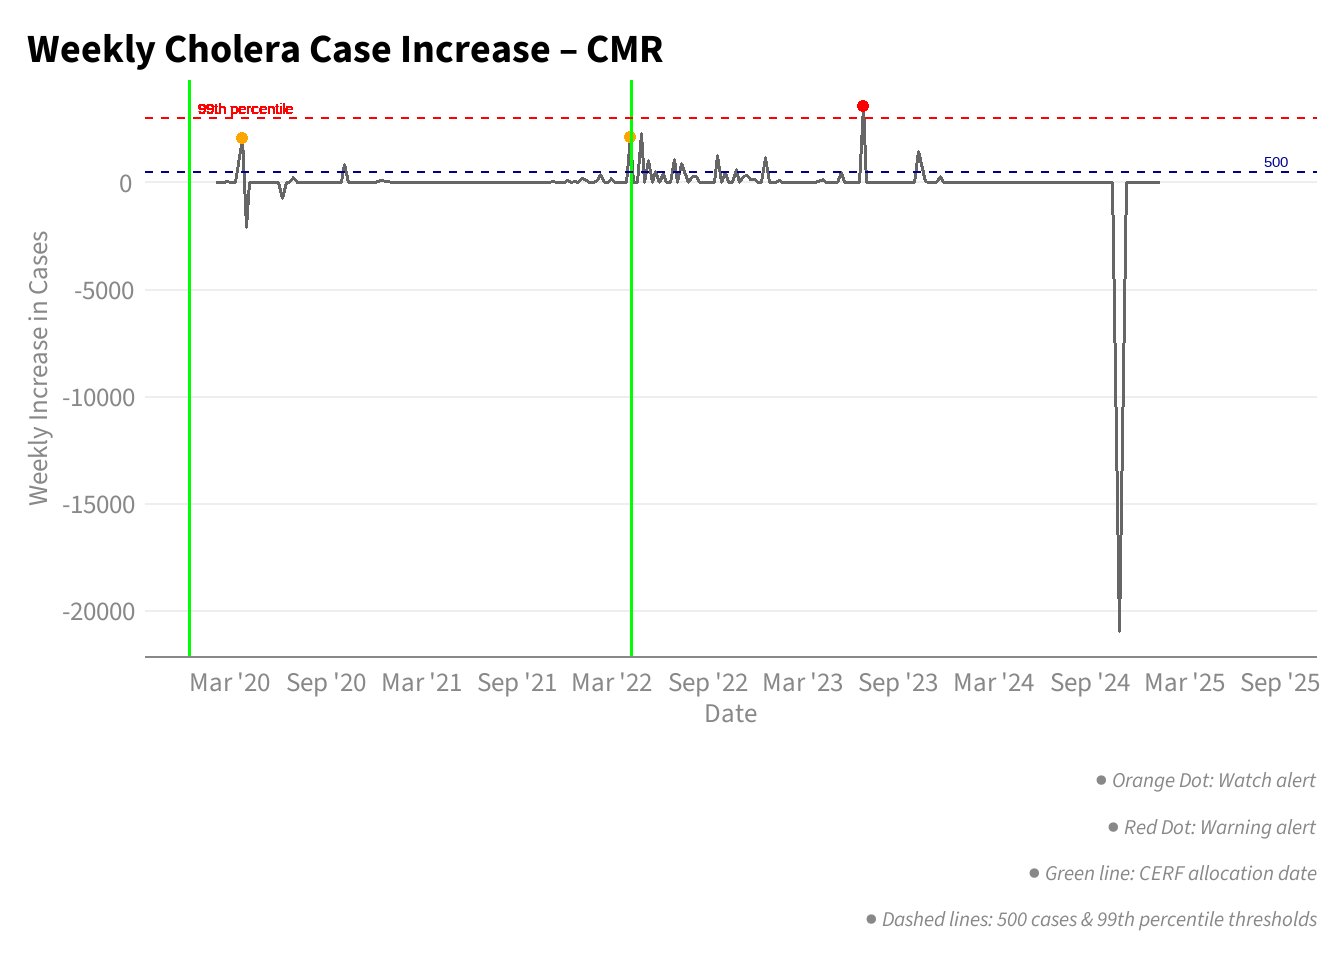
These plots show weekly cholera case increases for selected countries. Watch and Warning alerts are marked directly on the timeline, along with CERF allocation dates.
Country-Level Timelines with CFR
These plots display weekly cholera case increases for selected countries, with Watch and Warning alerts marked on the timeline alongside CERF allocation dates. The case fatality rate (CFR) is overlaid as a secondary axis to show changes in severity over time relative to case trends.